Itamar Syn-Hershko
Learn how to implement OpenTelemetry with OpenSearch for comprehensive observability. Complete guide covering distributed tracing, auto-instrumentation, collector configuration, and trace analytics for modern applications.
OpenTelemetry has emerged as the definitive standard for cloud-native observability, providing a unified framework for collecting logs, metrics, and traces. By standardizing how telemetry data is generated and collected, it frees developers from vendor lock-in and simplifies the process of monitoring complex, distributed systems. When this standardized data is paired with a powerful, scalable analytics engine like OpenSearch, you gain a comprehensive, end-to-end view of your application's performance and health.
This guide explores how to leverage OpenTelemetry with OpenSearch to build a robust observability platform. We will cover the core concepts of OpenTelemetry, the architecture for integrating it with OpenSearch, and how to use OpenSearch Dashboards to analyze the collected data, helping you identify bottlenecks, troubleshoot errors, and gain deep insights into your services.
The Three Pillars of Observability
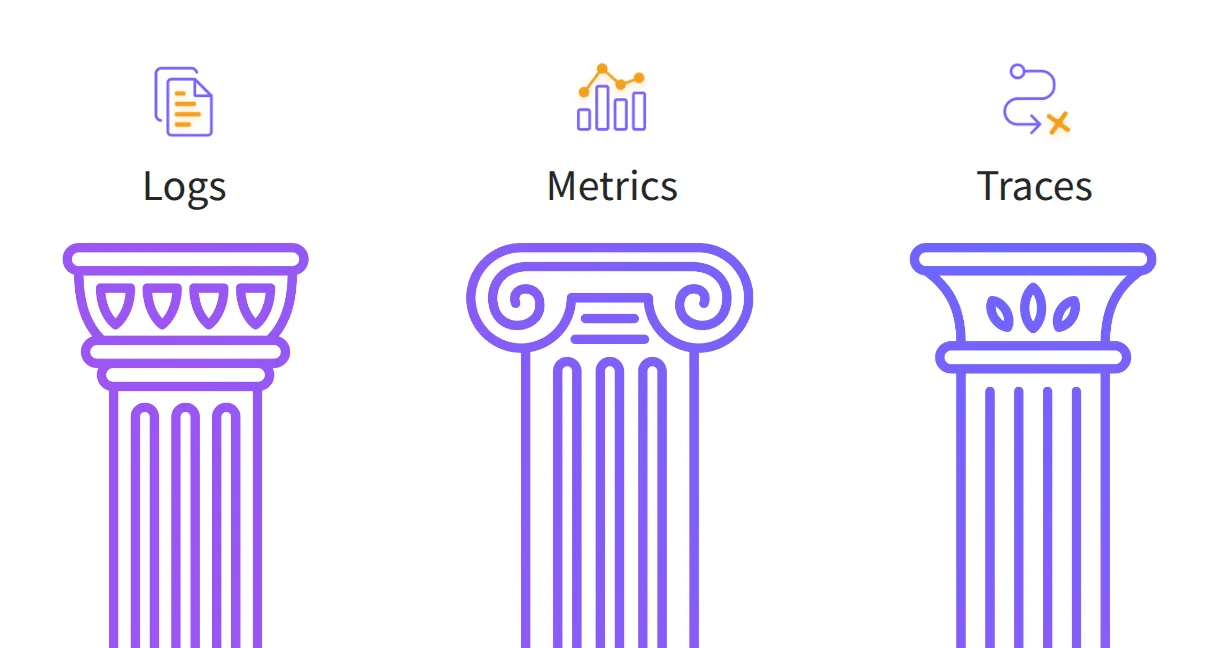
OpenTelemetry is built on three foundational pillars - logs, metrics, and traces - that together provide a complete picture of your system's behavior. While logs and metrics are familiar concepts, tracing introduces a powerful new dimension for understanding distributed systems.
- Logs: A timestamped record of a discrete event, such as an error or a state change.
- Metrics: A numerical measurement captured at a point in time, like CPU utilization or request count.
- Traces: A detailed record of a single request's journey as it travels through multiple services in a distributed environment.
Distributed tracing is essential for debugging microservices and serverless architectures. A trace represents the entire end-to-end path of a request, identified by a unique traceId. This journey is composed of individual units of work called spans. Each span represents an operation, such as a function call, a database query, or an API request, and contains metadata like its duration and status. By linking these spans together, you can visualize the entire request flow, pinpoint latency issues, and see exactly where an error occurred.
Integrating OpenTelemetry with OpenSearch
Combining OpenTelemetry with OpenSearch creates a powerful, scalable, and open-source observability solution. OpenSearch is well-suited for this task due to its proven ability to handle petabyte-scale data, its powerful aggregation and search capabilities, and its rich visualization tools in OpenSearch Dashboards.
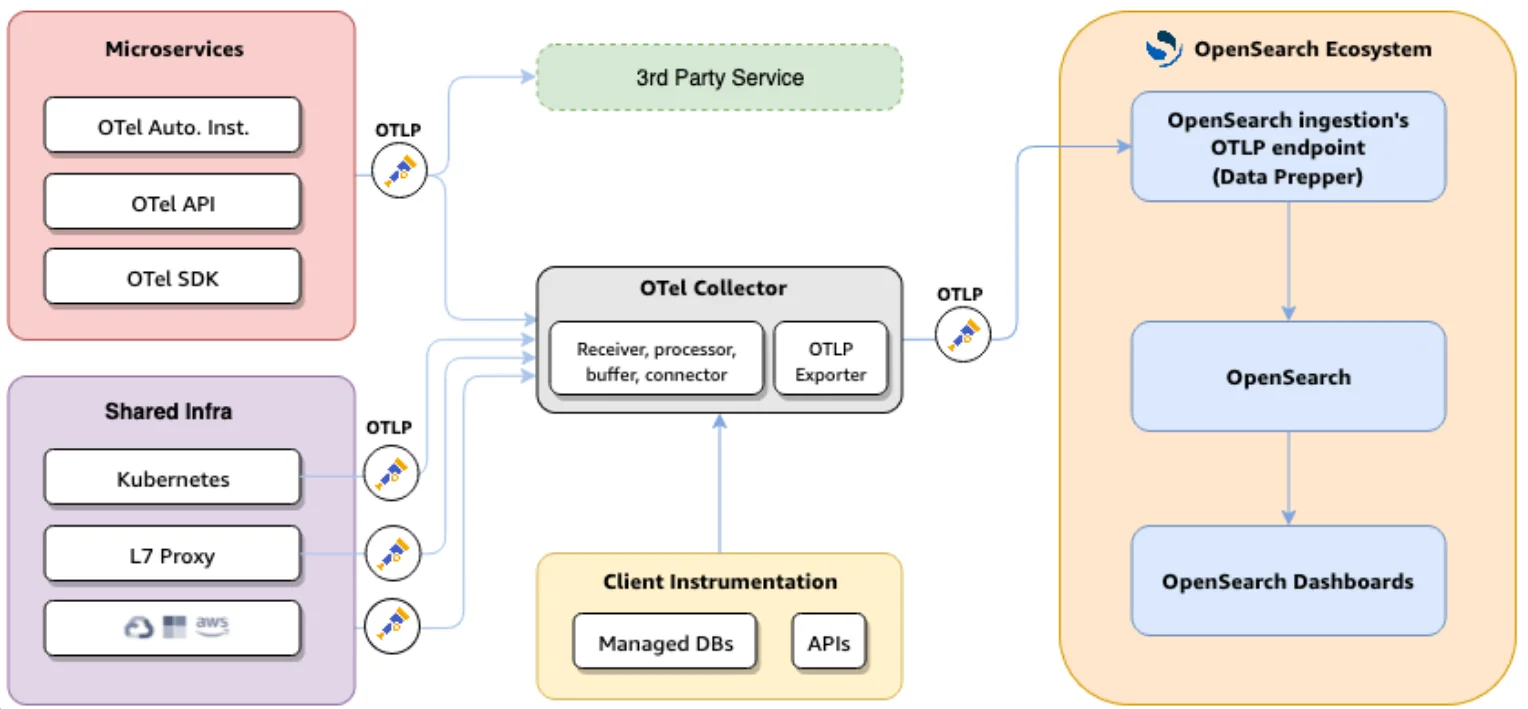
The typical architecture involves three main stages: Instrumentation, Collection, and Visualization.
1. Application Instrumentation
The first step is to configure your application to emit telemetry data. OpenTelemetry makes this incredibly easy with auto-instrumentation libraries for most popular programming languages. These libraries automatically detect common frameworks and libraries (like web frameworks and database clients) and generate traces and metrics without requiring manual code changes.
For example, to instrument a Python application, you can simply install the necessary packages and run your application with the OpenTelemetry executor.
# Install OpenTelemetry packages
  pip install opentelemetry-distro opentelemetry-exporter-otlp

  # Run your application with auto-instrumentation
  opentelemetry-instrument python my_app.py
This command starts your application with tracing enabled, sending the data to a configured collector.
2. Data Collection and Processing
The OpenTelemetry Collector is a high-performance, vendor-agnostic agent that receives, processes, and exports telemetry data. It acts as a central hub for your observability data, allowing you to perform operations like sampling, data enrichment, and routing to different backends. For integration with OpenSearch, the AWS Distro for OpenTelemetry (ADOT) is recommended as it includes a built-in exporter for OpenSearch.
Here is a sample configuration file for the collector (config.yaml) that receives data via the OpenTelemetry Protocol (OTLP) and exports it to an OpenSearch cluster:
receivers:
    otlp:
      protocols:
        grpc:
        http:

  processors:
    batch:

  exporters:
    opensearch:
      hosts: ["https://your-opensearch-domain:9200"]
      # For managed services, you may need user/password or AWS Sigv4 authentication
      # aws:
      #   region: "us-east-1"
      #   service: "es"
      index: "otel-v1-apm-span"

  service:
    pipelines:
      traces:
        receivers: [otlp]
        processors: [batch]
        exporters: [opensearch]
3. Ingestion and Visualization in OpenSearch
Once the data is sent to OpenSearch, it can be visualized and analyzed using the Trace Analytics plugin in OpenSearch Dashboards. This plugin provides a dedicated interface for exploring traces and services.
Another component in the OpenSearch ecosystem is Data Prepper, a server-side data collector that can receive, process, and enrich data before ingesting it into OpenSearch. While the OTel Collector and OpenSearch ingest pipelines can handle most processing tasks, Data Prepper is currently required to generate the Service Map visualization. However, future enhancements aim to integrate this functionality directly into the OpenSearch observability plugin.
Analyzing Service Quality & Performance with Trace Analytics
The Trace Analytics interface in OpenSearch Dashboards is the primary tool for turning your telemetry data into actionable insights. It offers multiple entry points for investigation, depending on your goal.
- Service Map: Provides a high-level, graphical overview of your application architecture. It visualizes the relationships between different services, showing key metrics like latency, error rate, and throughput for the connections between them.
- Services Dashboard: Allows you to drill down into the performance of individual services. You can monitor trends, view related traces, and identify which services are experiencing errors or high latency.
- Traces: Lists all individual traces, which you can filter and search to find specific requests. If a user reports an issue and provides a request ID (which should be the
traceId), you can paste it here to see the entire execution flow and diagnose the problem instantly. - Trace Discovery: A newer, more powerful entry point that provides a comprehensive overview of all traces, with easy-to-use filters for latency, errors, and other attributes, allowing you to quickly narrow down your search for performance issues.
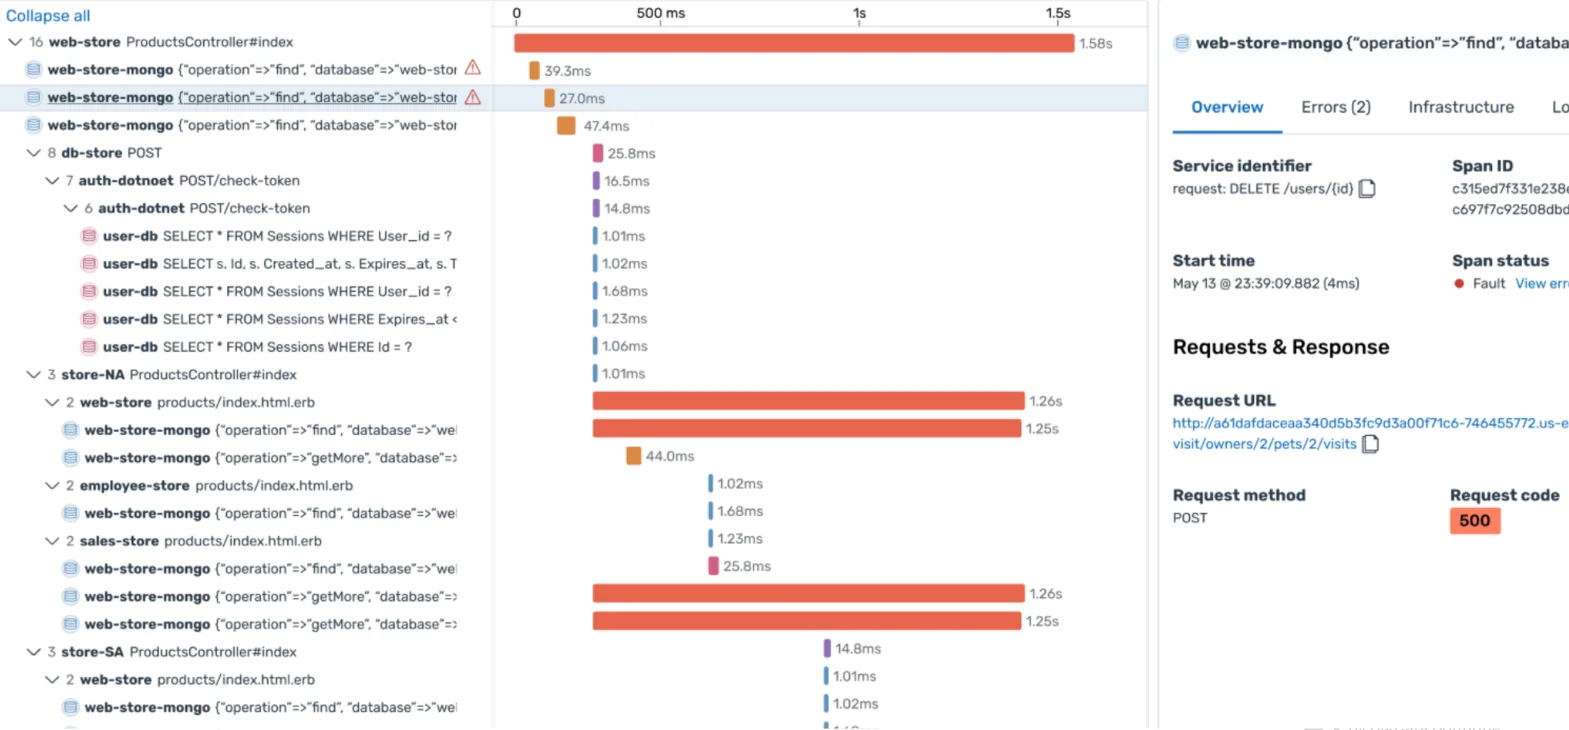
By correlating logs, metrics, and traces within a single platform, OpenSearch provides a holistic view of your system's health. You can start by identifying a spike in latency on a service dashboard, drill down to the specific traces that are slow, examine the individual spans to pinpoint the bottleneck, and then jump to the relevant logs from that exact time to get the full context, all within the same interface.
Designing an OpenTelemetry-on-OpenSearch observability stack? Our OpenSearch consulting services cover Data Prepper pipelines, retention/tiering for trace data, and full-stack observability rollouts.
Watch my session from OpenSearch Con North America (September 2025):