Presto Monitor
Monitor Presto cluster health and performance.
Ensure queries are running as intended, and derive empirical
insights to help optimize your spend and query performance.
Get Presto Monitor Now
Monitor Presto Nodes
View worker nodes performance and resource utilization. Easily locate under-provisioned or under-used nodes by CPU, load, memory, network performance and more.
Identify Patterns and Slow Queries
Show full query statistics and understand trends and usage patterns. Query execution time, CPU time used, data read and written and so on - can all be broken down by catalog, users, and more to identify optimization opportunities to help queries run faster.

Query timeline
Browse, search, filter and view queries using an interactive timeline. View queries in real-time or go back in time to locate specific queries based on a range of criteria.

Optimize Spend by Data-Driven Insights
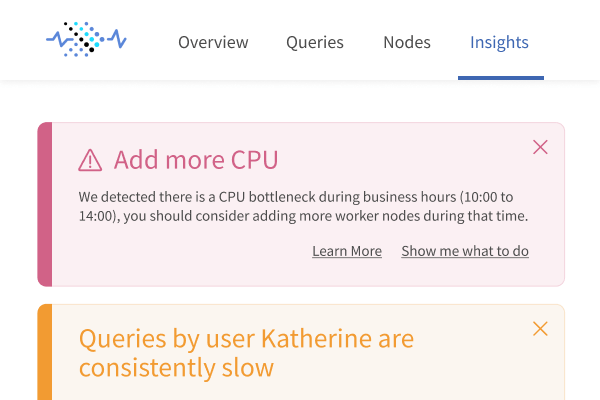
Our algorithms process your usage metrics and identify patterns, anomalies and optimizations opportunities. The insights provided by Presto Monitor are always actionable and allow you to empirically optimize your Presto cluster.

Review organization usage
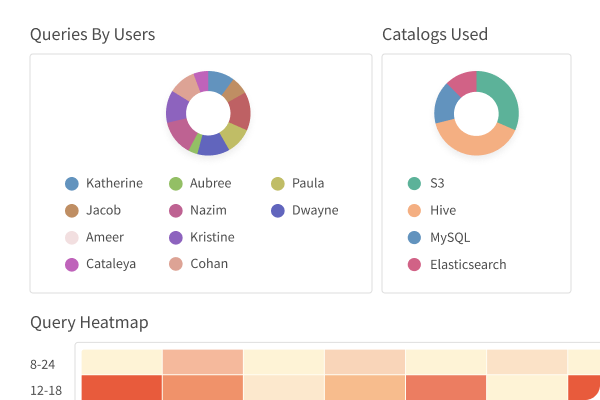
Identify heavy spenders consuming most of the CPU on your cluster. Learn which users and tables take up the most resources in terms of CPU and I/O so you can scale accordingly and eliminate bottlenecks - or alternatively, educate users for better usage.

Multi-cluster support
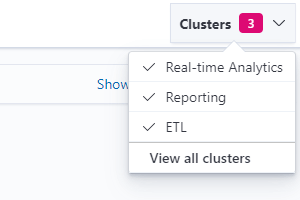
Do you have more than a single cluster to support different use-cases or different departments? Instead of having several confusing dashboards we allow you to see them all in one place, each cluster individually as well as in one aggregated view.

Seamless integration with Kibana
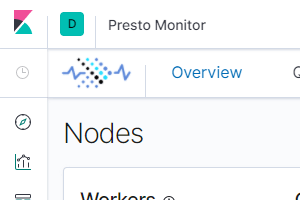
Presto Monitor can be installed as a first-class citizen Kibana application, so if you are a heavy Kibana user you can easily leverage Kibana’s deployment and user-management capabilities.
Easy setup, wide support
No-hassle installation and zero maintenance required. Fully supports installation on standalone Presto, Starburst Presto, AWS EMR, Google Dataproc and more.

