In this article, we'll discuss possible solutions when a join operation is required between two data sets in Elasticsearch. While SQL JOIN is not supported by Elasticsearch and OpenSearch, there are some ways to work around that in some use-cases. Read along to discover how.
Wake up an Elasticsearch consultant in the middle of the night and present your modeling/query issue, probably one of the first things he’ll mention is that “Elasticsearch doesn’t have joins”. As normalizing schemas and relying on joins are basic principles of work with relational databases, that disclaimer is often repeated when dealing with Elasticsearch. However saying what can’t be done isn’t enough - it needs to be accompanied by “what can be done” - information that would help determine whether Elasticsearch is a good fit for the requirement, and if so how it can be achieved. This post goes through the basics of what can be achieved and how.
We'll discuss the general approach to joins, then delve into a use case of joining several events from a session, displaying the results in the Lens and Vega Kibana visualizations. Finally we'll look at the new and experimental Lookup Runtime Fields feature available since Elasticsearch 8.2 .
General approaches to Elasticsearch joins
Elasticsearch’s strengths come into play in areas of full text search and fast aggregation and indexing, with a scalable infrastructure that handles more load as you add more nodes. It is not a relational database, and while it can handle some use cases also handled by a relational database, care should be taken to avoid misuse and correctly model the data.
The join limitation dictates that we consider whether data which in a relational database would be composed of several “entities” can be denormalized into a single schema. That usually means a join-on-write, meaning we create an entity which is a combination of the entities involved and write it to an index on Elasticsearch. However, things are not always that simple: sometimes the document count of the entities involved makes this a non-option, or maybe the query requirements are too complex for a combined schema. When denormalzing we need to avoid having the “n” side from a “1:n” relation in a single document. That is, a single Elasticsearch document cannot contain several instances of an entity, if we have to search for several properties or values in a single instance.
One way to bypass that limitation is using nested mapping - this tells Elasticsearch that a field actually represents an “inner index” of documents. That way is costly in performance, storage, and query complexity - we won’t go over it here, but suffice to say we try to avoid it when possible.
If the join use case is analytics, what we often just call OLAP (On-Line Analytical Processing) - that is, reports and ad-hoc queries that do not require sub-second performance, one way to overcome the join limitation is using Trino and our Elasticsearch connector. Trino (formerly known as Presto) is a query engine capable of querying and joining data from multiple databases, and specifically can allow you to join data from Elasticsearch instances.
The sessions use case
But what if this isn't strictly analytics, and denormalization and nesting can’t be achieved? One possible use case with this issue is a system with events or logs (or, an event model), where series of documents (let’s call each such series “a session”) need to be grouped together to understand session-level data. Elasticsearch has aggregations which allow certain types of grouping, but the capabilities of those are limited - specifically, if the product of the cardinality of both sides of the join (not filtered by each other) is in the hundreds of thousands, aggregations are not a relevant solution (but we’ll discuss how to best use them further below).
If that grouping cannot be achieved using aggregations, then one way to achieve this is to write an index - possibly an additional index - where the key is the session id, and then update it every time a document from that session arrives - that is, keep a session-based model. There are a couple of ways to achieve this. Elasticsearch’s Transforms functionality does this by repeatedly aggregating on a source index. Another way is to transform the document on write and send it to the “session index” as well, with all documents from the same session having the same id, thus updating the session with the information from all relevant documents. This can be done in the layer writing to Elasticsearch - be that application layer, or an ingest tool such as logstash.
However if the use case falls within the limitation of aggregation use, there are some workarounds that can be attempted using Kibana, which are based on creating a cartesian product of both sides and then showing the sessions which have data on both sides - sort of a simulation of an inner join.
Pseudo-join in a Lens table visualization
With Kibana, something to that extent can be achieved using the Lens visualization. Lens is a versatile visualization tool allowing to create various types if graphs and even a table with simple customizations.
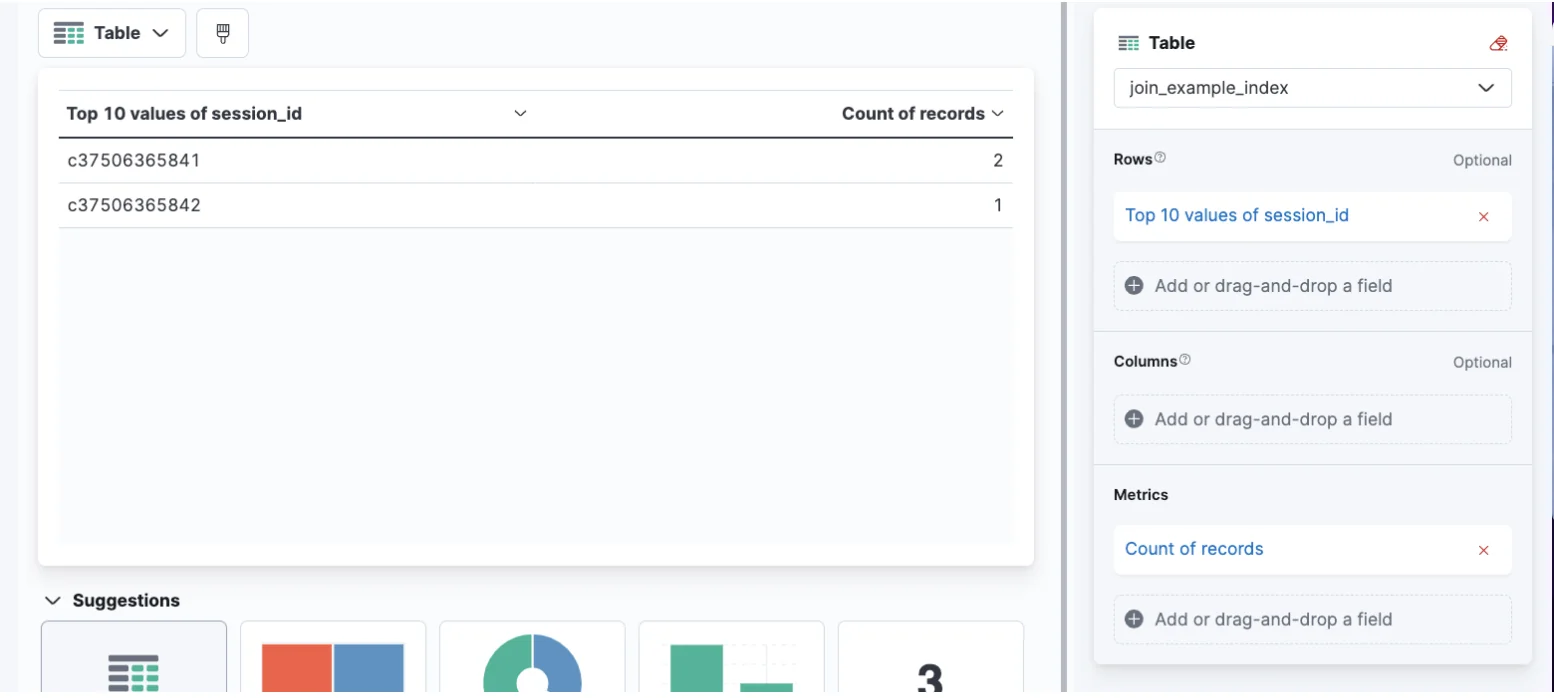
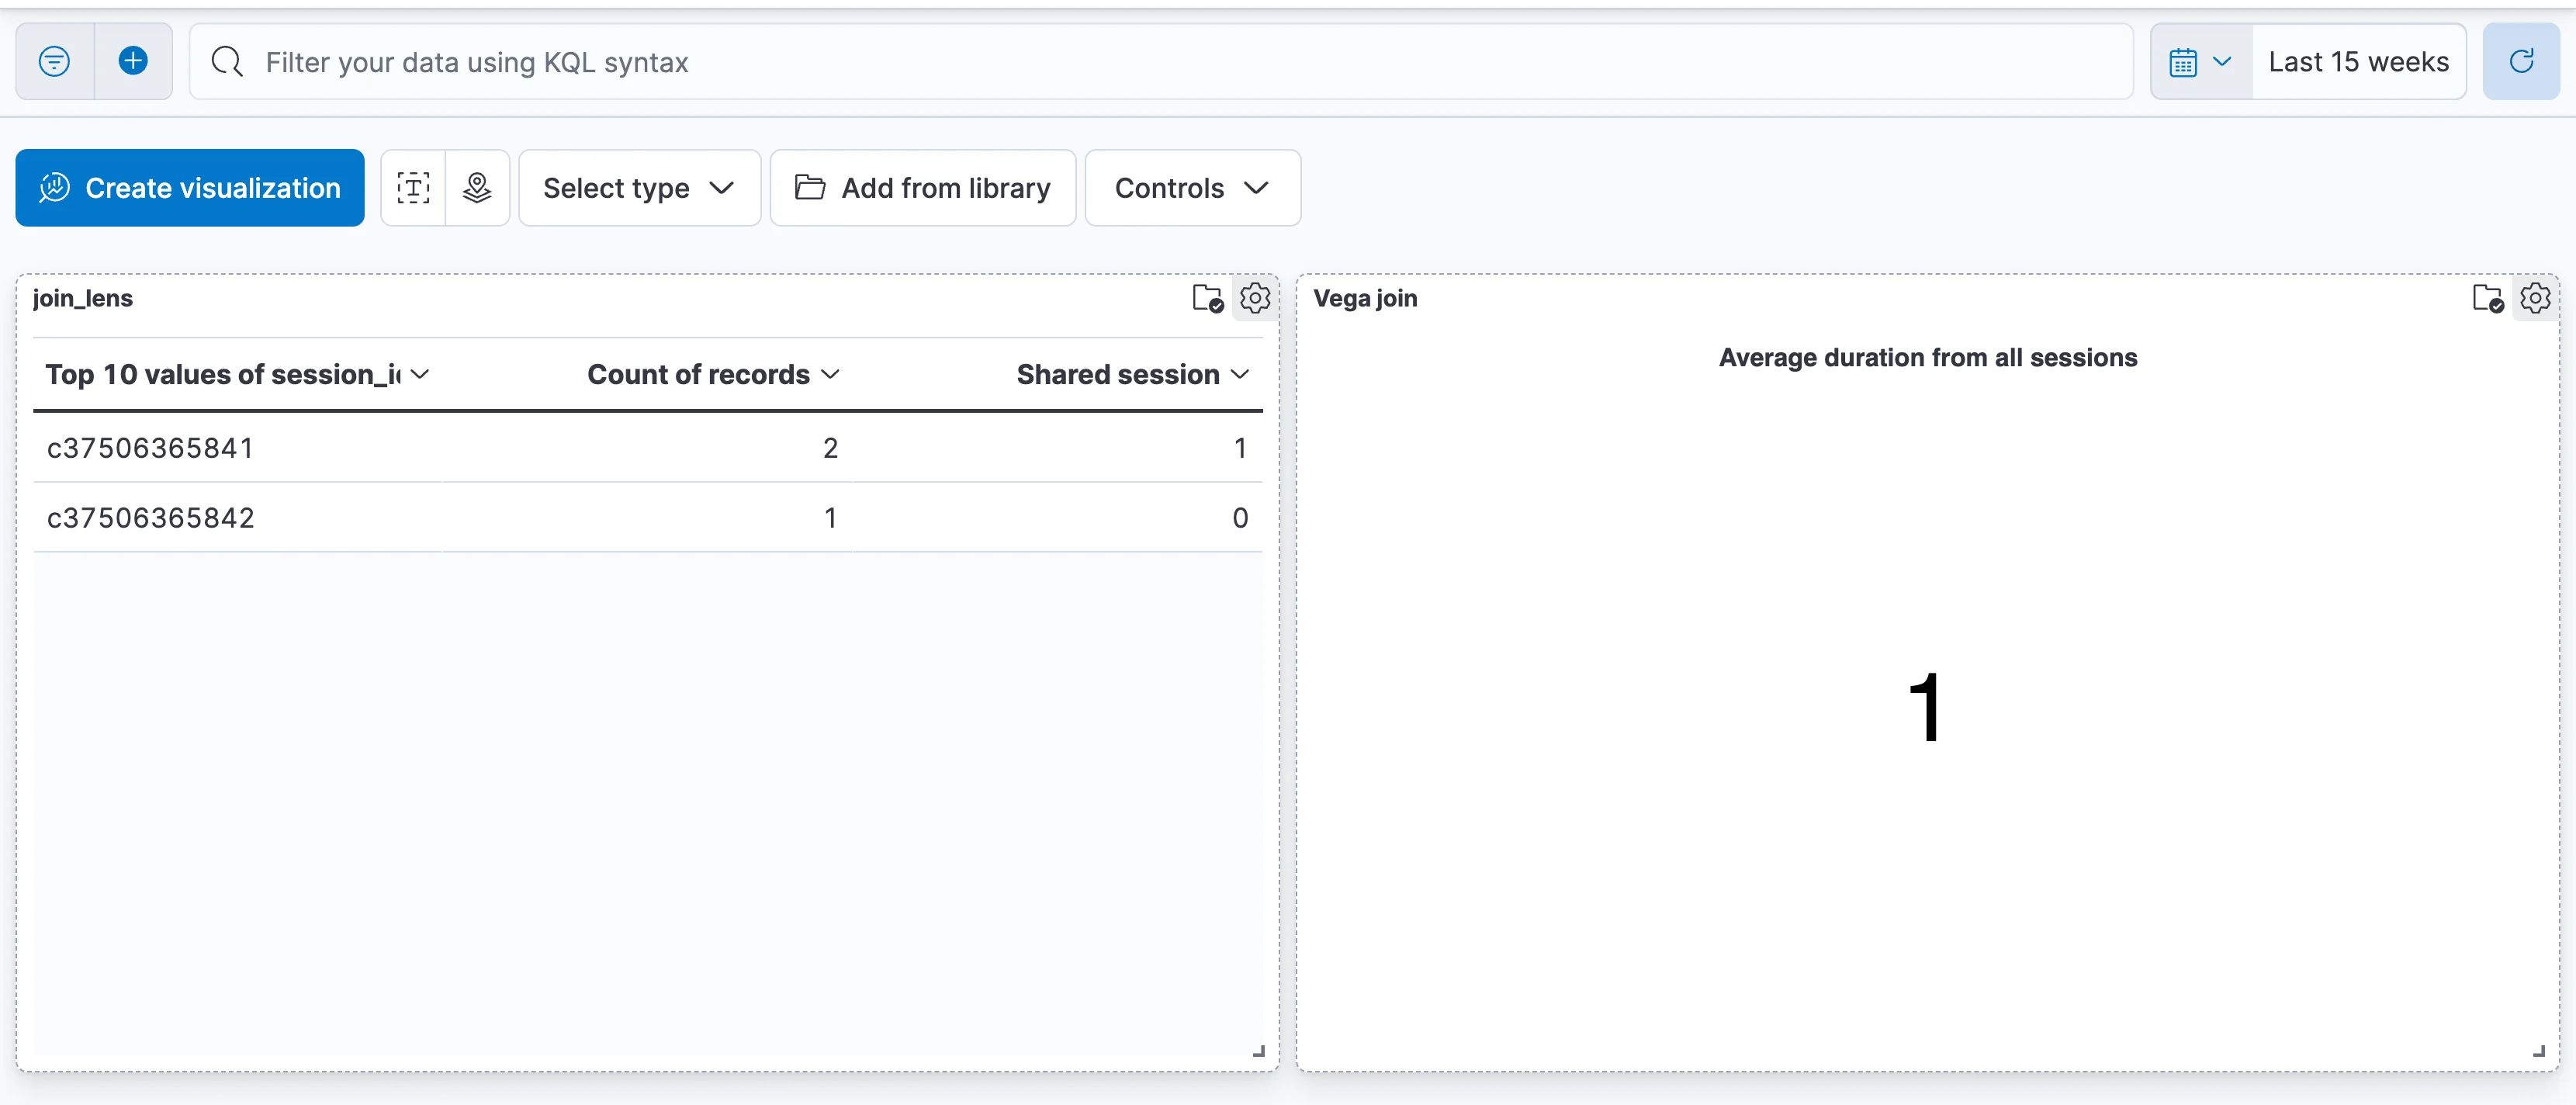
Let’s start by making a simple table that counts the amount of records for each session_id:
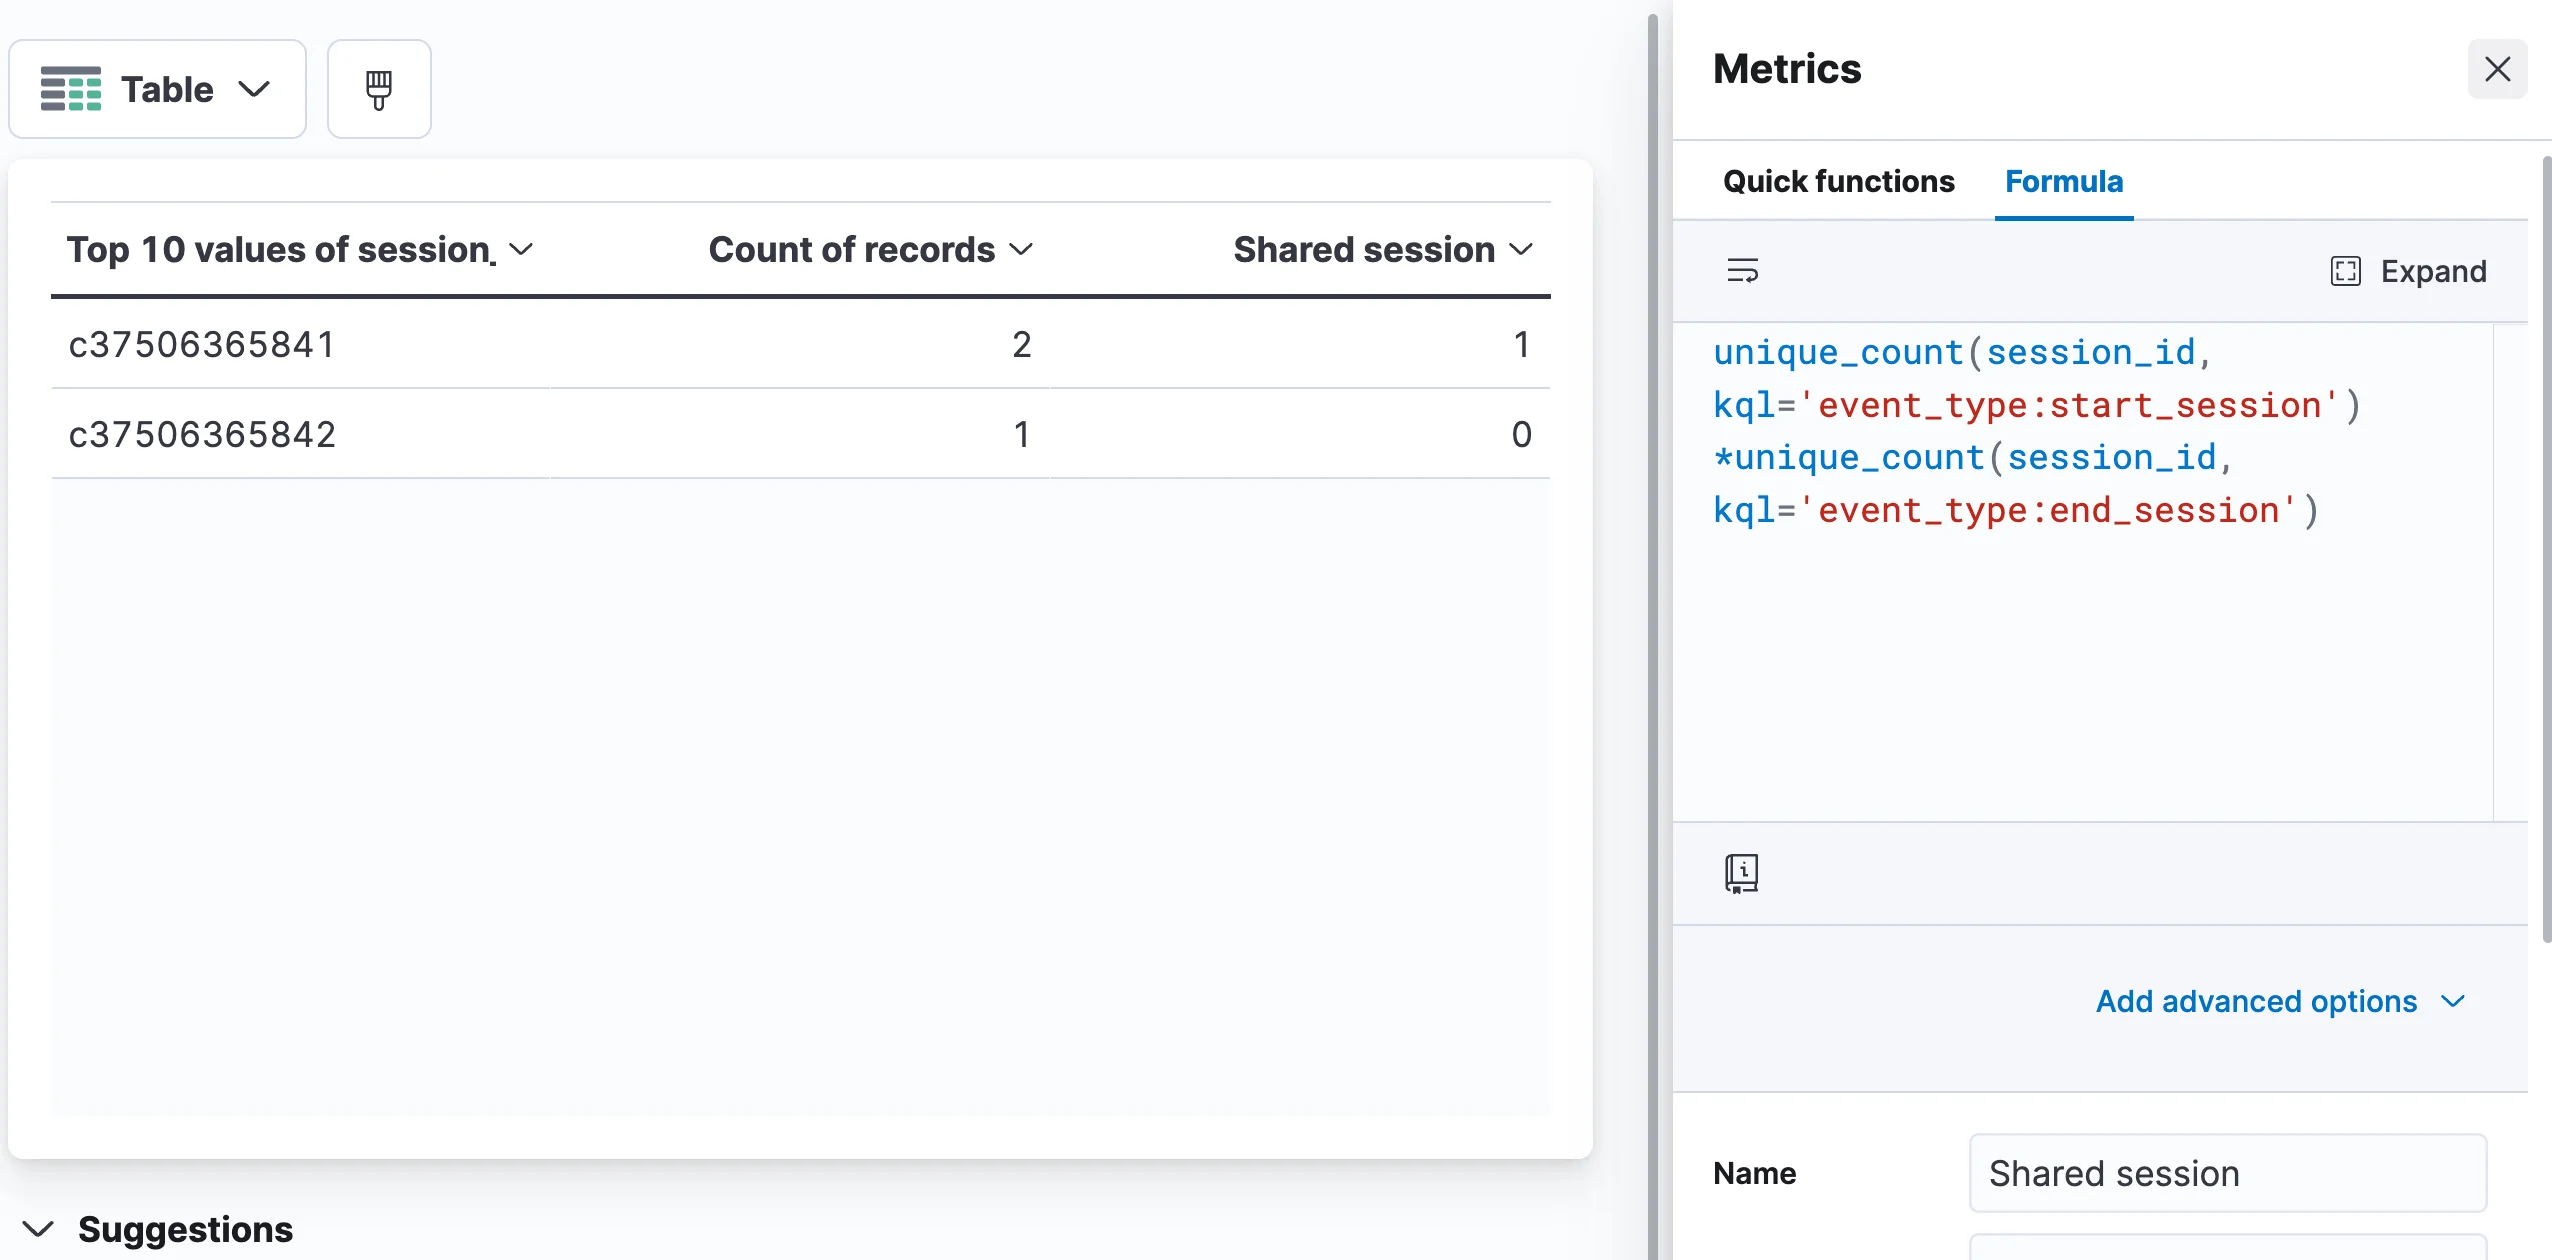
Great! But what we want to know is whether we have data for both types of events, let’s say type “start_session” and type “end_session”. To achieve that we need an additional metric that’s supported by a formula, which calculates whether this id has both types of events.
We can then sort the “shared session” column by the value and get the shared sessions first.
Pseudo-join in a Vega visualization
If we want a visualization that’s a bit more complex, such as one that filters out the irrelevant sessions, we can use Vega.
Vega is a declarative format for creating, saving, and sharing visualization designs. It is available for use in Kibana as a visualization that can be incorporated into dashboards. As a basis for its data, it can use an Elasticsearch query. The query results can then be transformed, and then formatted to display as one of several visualization types within Vega.
So, for instance, to solve the issue of joining together events into sessions, we can create an Elasticsearch query that does this, and then format its results to display within Vega.
We’ll first start by building and testing that query in Elasticsearch, and then show how to incorporate it into Vega.
Let’s say our index, "sessions", has a property called “session_id”. What we want is to get the events that signify the start and end of that session. We’d have to filter out sessions where we don’t have both start and end events. Finally we’ll calculate the difference between the start and end time of the session, and then get an average of that over all of the sessions.
{
  "size": 0,
  "aggs": {
    "sessions": {
      "terms": {
        "field": "session_id",
        "size": 10
      },
      "aggs": {
        "starts": {
          "filter": {
            "term": {
              "event_type": "start_session"
            }
          },
          "aggs": {
            "date": {
              "min": {
                "field": "creation_date"
              }
            }
          }
        },
        "ends": {
          "filter": {
            "term": {
              "event_type": "end_session"
            }
          },
          "aggs": {
            "date": {
              "min": {
                "field": "creation_date"
              }
            }
          }
        },
        "duration": {
          "bucket_script": {
            "buckets_path": {
              "starttime": "starts>date",
              "endtime": "ends>date"
            },
            "script": "(params.endtime - params.starttime)/1000/24/60/60"
          }
        },
        "select": {
          "bucket_selector": {
            "buckets_path": {
              "start": "starts._count",
              "end": "ends._count"
            },
            "script": "params.start > 0 && params.end > 0"
          }
        }
      }
    },
    "average_duration": {
      "avg_bucket": {
        "buckets_path": "sessions.duration"
      }
    }
  }
}
So, getting the start and end date for the session is achieved by filter and min/max aggregations. Then removing the sessions without both is achieved by a bucket selector. Calculating the duration per session is achieved with a bucket script, and finally the average duration is achieved using the average bucket aggregation.
Keep in mind that the number of buckets an aggregation can return is limited to a default of 65,536 - above that number, Elasticsearch would return an error. To know whether we’re going to meet that limit, we multiply the number of session ids by 3, as each session has buckets for the dates as well as the duration. Consider that buckets removed by the bucket selector are still counted towards the total for the limit check. Obviously the number of sessions depends on the filters that are applied on the query, such as the time filter.
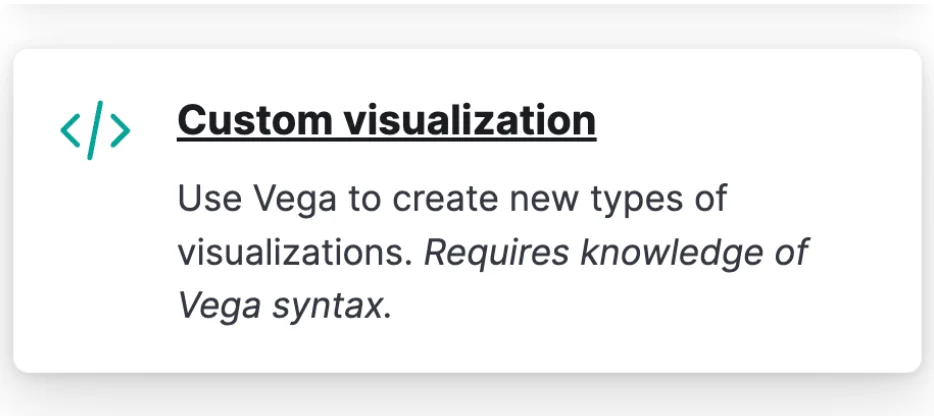
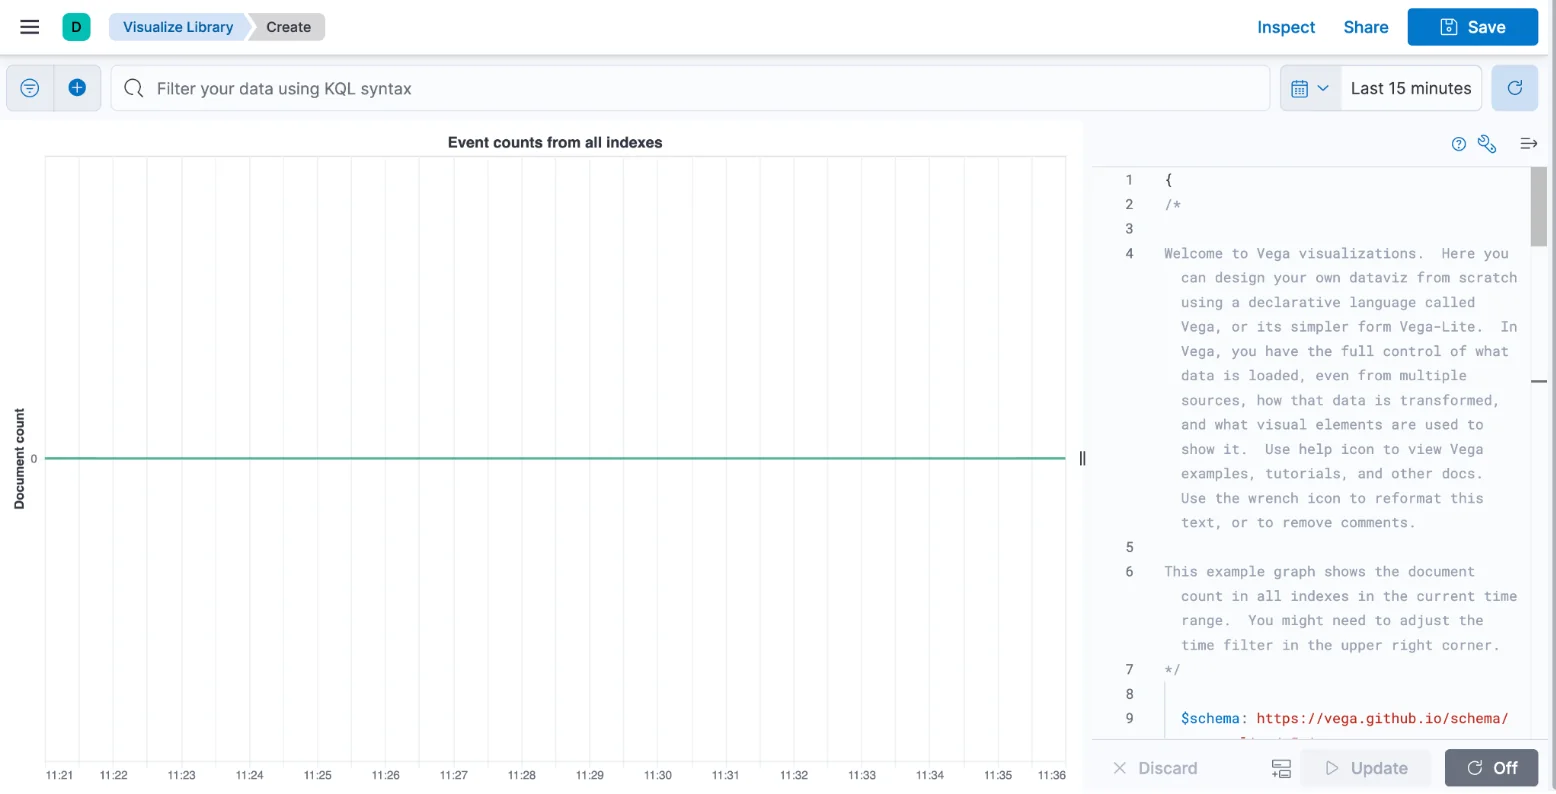
We now turn to using that aggregation in Vega. When creating a new visualization, we need to choose “Custom visualization”.
This shows the default vega visualization. On the right side of the screen you can see the input for the code for the visualization, while the left side shows the visualization itself. At the top you can find the KQL and time filters, just as you would with any other visualization or dashboard in Kibana.
The full syntax of the visualization we’ll create is here. Let’s go over each part of it:
"$schema": "https://vega.github.io/schema/vega-lite/v5.json",
"title": "Average duration from all sessions",
This indicates which version of Vega should be used, and the title of the visualization
The next part defines the data source for the visualization:
"data": {
"url": {
"%context%": true,
"%timefield%": "creation_date",
"index": "sessions",
"body": {
"aggs": { //...
},
"size": 0
}
},
"format": {"property": "aggregations.average_duration"}
},
Notice we’re telling Vega to use the KQL filter, and use the time filter over the date field of the index. In the middle we can see the query that we’ve already shown, and then an indication for Vega to to pull the data from a specific path in the aggregation result, which is the average duration of the sessions.
"mark": {"type": "text", "fontSize": 50},
"encoding": {"text": {"field": "value", "type": "quantitative"}}
Finally, this part defines how the data pulled from the aggregation would be displayed. In this case we’ve created a very simple “metric” visualization that displays the average duration as a text field. Another possible use is to create a line graph showing the average duration for sessions over time. Unfortunately a table visualization cannot be created using Vega.
Here is the Vega visualization alongside the Lens visualization in a dashboard.
Of note, but not shown in the example, is the ability to transform the data after it is returned from Elasticsearch but before it is displayed. This can be achieved using vega transforms, of which you can read more about in the documentation.
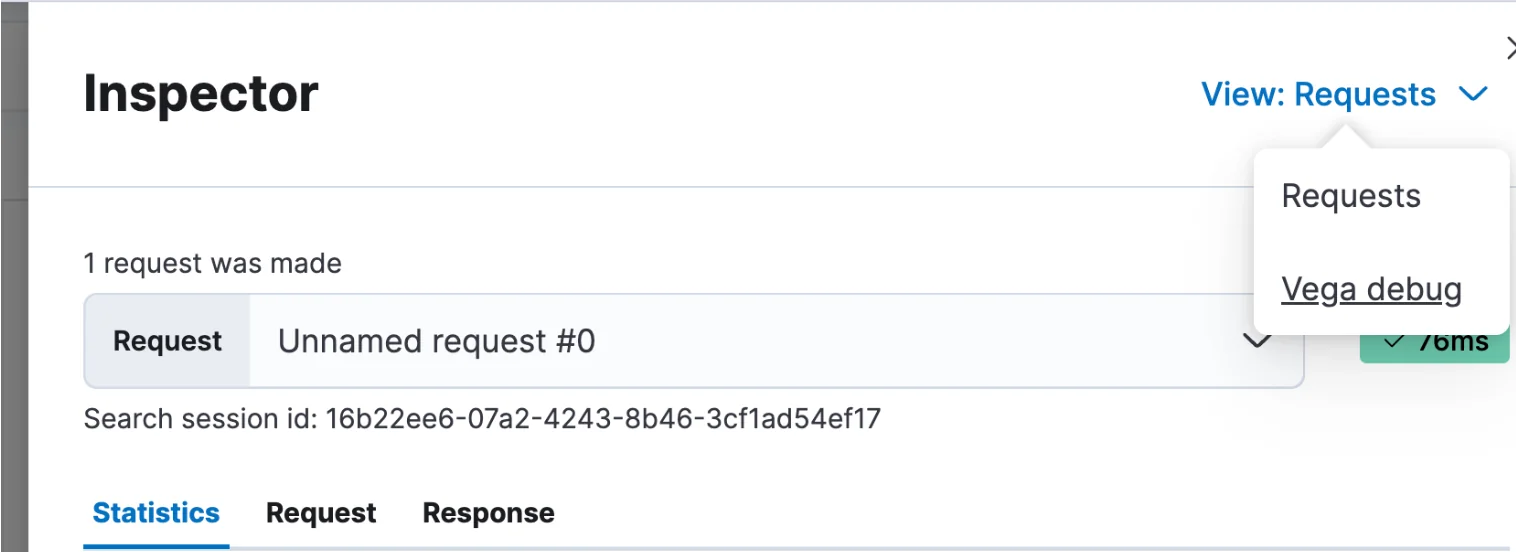
In general it is often difficult to find examples relevant to your Vega use case. One feature that’s useful while trying to get to the correct syntax is the debugger. You can get to it by clicking “Inspect” at the top of the screen and then clicking on “View” and choosing “Vega debug”. Under “data sets” you will find the data available to the visualization. Also under View is the response data returned from Elasticsearch.
Lookup Runtime Fields
One option that’s available since Elasticsearch 8.2 as an experimental feature is Lookup Runtime Fields. Lookup Runtime Fields are a special type of runtime fields, which are fields calculated while running the query, rather than indexed in advance (at a performance cost, naturally). LRFs allow you to attach a field from a separate index for each result document by defining the field to link by in the target and source index. In a sense this is similar to a left outer join, but this functionality is very limited - one can’t query or aggregate on an LRF, and if the condition matches several documents a value from a random document will be returned. The following is a query implicitly matching all of the documents in the source index, that adds an LRF from another index.
{
  "runtime_mappings": {
    "description": {
      "type": "lookup",
      "target_index": "sessions_descriptions",
      "input_field": "session_id",
      "target_field": "session_id",
      "fetch_fields": [
        "description"
      ]
    }
  },
  "fields": [
    "description"
  ]
}
Thanks to Aviv Berko and Netanel Malka with whom I’ve worked on implementing some of the solutions described in this article.


