In the journey for peak performance and lowest possible cost, the Elasticsearch Java heap size plays a significant role. What is the right value for ES_HEAP_SIZE? Is there a right number to always use? In this article we ignore all the disinformation and get to the optimal answer using benchmarks.

Elasticsearch is a complex distributed system, and as your dataset and query volume grow, the cost of operating a cluster grows as well. To help reduce the operating cost, Elasticsearch provides you with many different levers to tune the performance for each cluster.
This is the first in a series of articles about tuning your Elasticsearch cluster. In this article, we start discussing one of the two most common levers available for tuning a single node in a cluster: heap size and garbage collection algorithm. Those are also the ones with most confusion and even disinformation spread on online forums.
This series is being written after many years of consulting many customers world-wide on a variety of use-cases, cluster sizes and hardware specs - ever since Elasticsearch 0.11 was released 11 years ago. We helped many projects succeed and while every engagement required attention to different details, eventually the basics are all the same and we always start at the same point.
In follow-up posts we'll examine levers more applicable in specific Elasticsearch use cases, as well as tuning the performance of an entire cluster. And as we usually do in our work with customers, we will use tooling and scientific methods and not just guesswork.
Java Heap Space
First a quick background: What is heap used for? In all computer programs, "the heap" is the part of memory where all data that lives longer than a single function call is stored. In Java and other garbage-collected languages, the application can freely request memory from the heap, and simply forget about it when it's no longer necessary. This makes application programming much simpler, but it requires a separate step to happen later on to "collect the garbage", which finds the discarded data and makes that space available for the program to use again.
Elasticsearch, like all Java applications, allows us to specify how much memory will be dedicated to the heap. Using a larger heap size has two advantages: caches can be larger, and garbage collection can be done less often. For caches, Elasticsearch dynamically sizes its internal caches based on the amount of heap size available. Correctly sized caches can have a huge impact on the overall query performance.
Garbage collection frequency is more nuanced. On one hand, a smaller heap results in more frequent garbage collections. If responding to a single query requires Elasticsearch to run the garbage collector multiple times, it can severely degrade the performance of the cluster. On the other hand, a larger heap means that each garbage collection takes longer, and these longer pauses can also lead to reduced performance.
The official documentation specifies that 50% of available system memory should be set as the heap size for Elasticsearch (also known as the ES_HEAP_SIZE environment variable). It also recommends not to set it to more than 26-30GB due to pointer compaction. Online forums are full with contradicting advice that is unfortunately too visible, more than the official docs. So, is there an actual number we could recommend as the heap size to use?
Running Benchmarks
Let's look at these in concrete terms with some benchmarks. We are going to use Rally, the official benchmarking tool for Elasticsearch, and we'll be using the geonames track. This track has a variety of challenges which stress disk, memory, and CPU differently, so it makes a good benchmarking candidate. The total dataset size is 3.3 GB.
For our first benchmark we will use a single-node cluster built from a c5.large machine with an EBS drive. This machine has 2 vCPUs and 4 GB memory, and the drive was a 100 GB io2 drive with 5000 IOPS. The software is Elasticsearch 7.8.0 and the configuration was left as the defaults except for the heap size. We will test 6 different heap sizes, from 200 to 2600 MB.
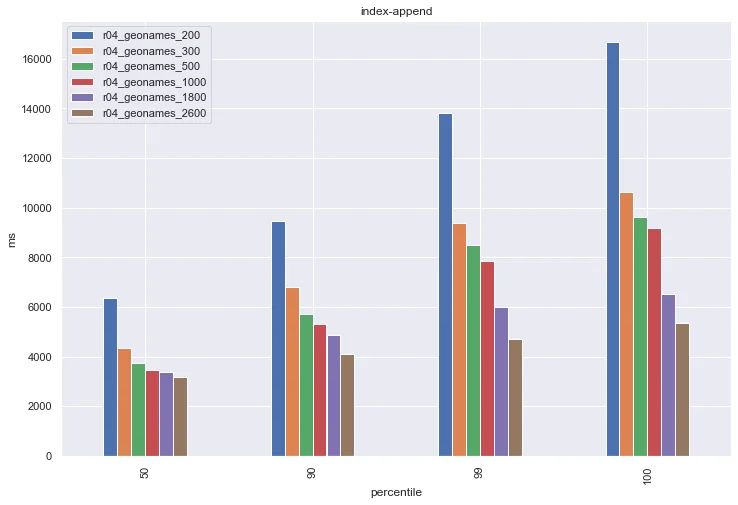
After running the track for each group, we'll look at the percentile latency metrics for the `index-append` challenge (lower is better). This challenge is where the benchmarking framework is populating the index, so it is 100% writes and 0% reads.
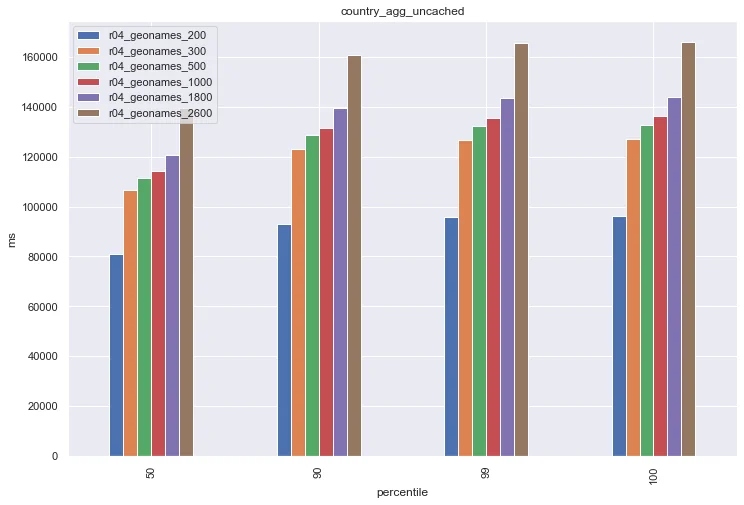
Here we can see a very straightforward answer that more heap is better, right? Well, if your use-case is using Elasticsearch as an append-only log, this might be true, however once we start performing reads we can see a very different story. Let's examine the country_agg_uncached challenge. In this challenge, the Elasticsearch request cache is manually disabled. In production, this is analogous to servicing a very diverse query pattern with few repeated queries, so the query cache isn't as effective.
Here we see that the smaller heap size had the best performance. What happened? The key insight here is that "free memory" does not mean "wasted memory". The operating system actually uses all of its free memory as a cache for the filesystem. By using a smaller heap size, more of the underlying data can fit into this cache, and so the responses are faster.
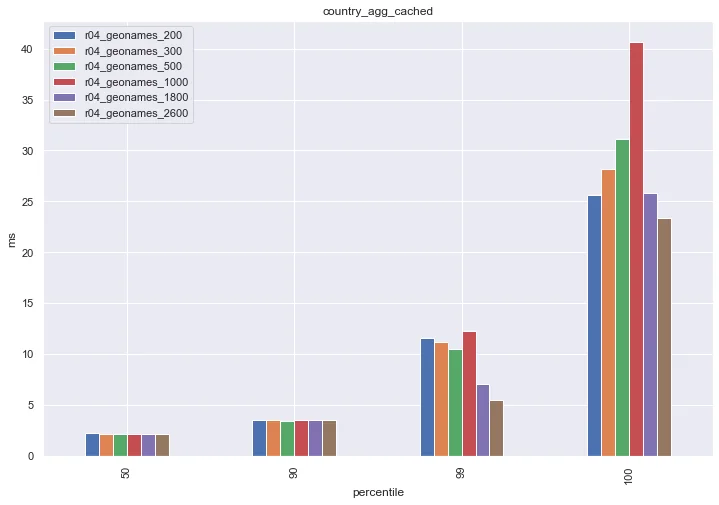
In most cases, finding the right heap size is a balancing act. Let's take a look at the country_agg_cached challenge, which is the same as the previous one but with query caching enabled.
Here we see that the 200 MB and 2600 MB have comparable performance. This is because at the larger heap sizes, Elasticsearch's cache was large enough to accommodate the benchmark's query set, and so Elasticsearch didn't need to access the filesystem to service these requests. Notice here the 1000 MB group had the worst performance: the Elasticsearch cache wasn't large enough to fully service all of the queries, and the large heap size took space away from the filesystem cache.
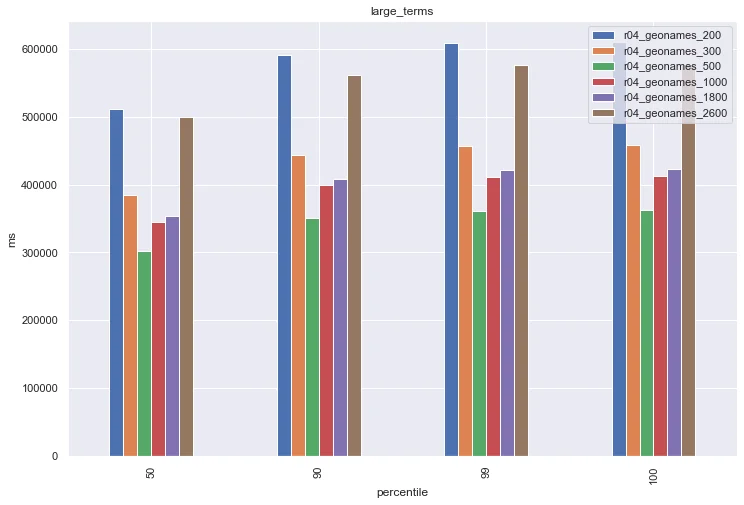
To really drive home my point that proper heap sizing is a balancing act, let's look at the large_terms challenge:
This challenge actually has the best performance on the middle heap sizes. When you are investigating proper heap sizes for your cluster, it's important to ensure that you are testing on a workload that's comparable to your production workload. These examples should demonstrate that one heap size isn't the best answer for every cluster.
Of course, for this benchmark we used a relatively small machine. For real data nodes, while you will observe a similar behavior in benchmarks of course the actual numbers will be different, and memory will be used more optimally since there's of course the overhead of the software itself. The key point remains - you'll need to benchmark for your real workload, with real data.
Key Takeaways
These benchmarks highlight how small changes to the configuration can have very different effects depending on the workload, and how each workload will have its own sweet-spots. Optimizing an Elasticsearch cluster for top performance and lowest-possible costs is a matter of delicate balancing work between quite a few levers and toggles. The Java Heap size used is just one of many.
While the official advice is to set 50% of available system memory for the heap size, and not to set it to more than 26-30GB due to pointer compaction, in more recent versions Elasticsearch is attempting to set the actual heap size automatically. Now it is clear how benchmarking can help find the right value to use, with the optimal value going to highly depend on the desired workload, not only on node role.
We at BigData Boutique specialize in taking detailed measurements of your production workload and creating benchmarks specifically tailored to your environment. We will make detailed recommendations based on what we find and provide support on deploying our recommendations into production. If you would like professional advice for your cluster, contact us to get started!


