Itamar Syn-Hershko
In this blog post, we'll review the available ways to monitor your Amazon OpenSearch Service cluster, aiming to offer a comprehensive guide to help you choose the perfect tool.
Introduction
OpenSearch is one of the most popular software tools in the industry. It’s revered for its multifaceted functionality spanning Search, as well as Observability, Security Information and Event Management (SIEM), and – in recent OpenSearch versions – even as a Vector Database. As a result, OpenSearch has become a critical part of many companies' software stacks.
This is why maintaining the stability and peak performance of OpenSearch clusters is paramount. Achieving this goal calls for robust monitoring solutions tailored specifically for OpenSearch.
In this blog post, we’ll review and dive into the monitoring tools available, aiming to provide a detailed roadmap for selecting the ideal tool for monitoring your OpenSearch clusters.
What Makes a Good OpenSearch Monitoring Tool?
Before diving into the evaluation of OpenSearch monitoring tools, it's essential to delineate the key attributes that define an ideal monitoring solution for OpenSearch clusters:
- Comprehensive Monitoring Scope: Your monitoring tool should provide insights into the OpenSearch process, the underlying operating system, and the Java Virtual Machine (JVM) hosting OpenSearch. This ensures a holistic understanding of the cluster's health and performance.
- Feature-Rich Capabilities: The ideal monitoring tool should offer a wide array of features, including the collection of operating system metrics such as CPU and RAM usage, JVM metrics like heap usage and Garbage Collection (GC) total count, as well as OpenSearch cluster metrics such as query response times and index sizes. Additionally, the tool should let you create alerts, visualizations, and dashboards for comprehensive monitoring.
- Scalability and Cost-Effective: Scalability is crucial to accommodate the growth of OpenSearch clusters, while cost-effectiveness ensures that monitoring solutions remain viable for organizations of all sizes.
Now, let's explore some of the prominent monitoring tools available in the market:
6 OpenSearch Monitoring Tools To Consider
1. CloudWatch
CloudWatch is a monitoring and observability service from Amazon Web Services (AWS) that offers seamless integration with OpenSearch. It lets users collect and track metrics, monitor log files, set alarms, and automatically react to changes in their OpenSearch clusters.
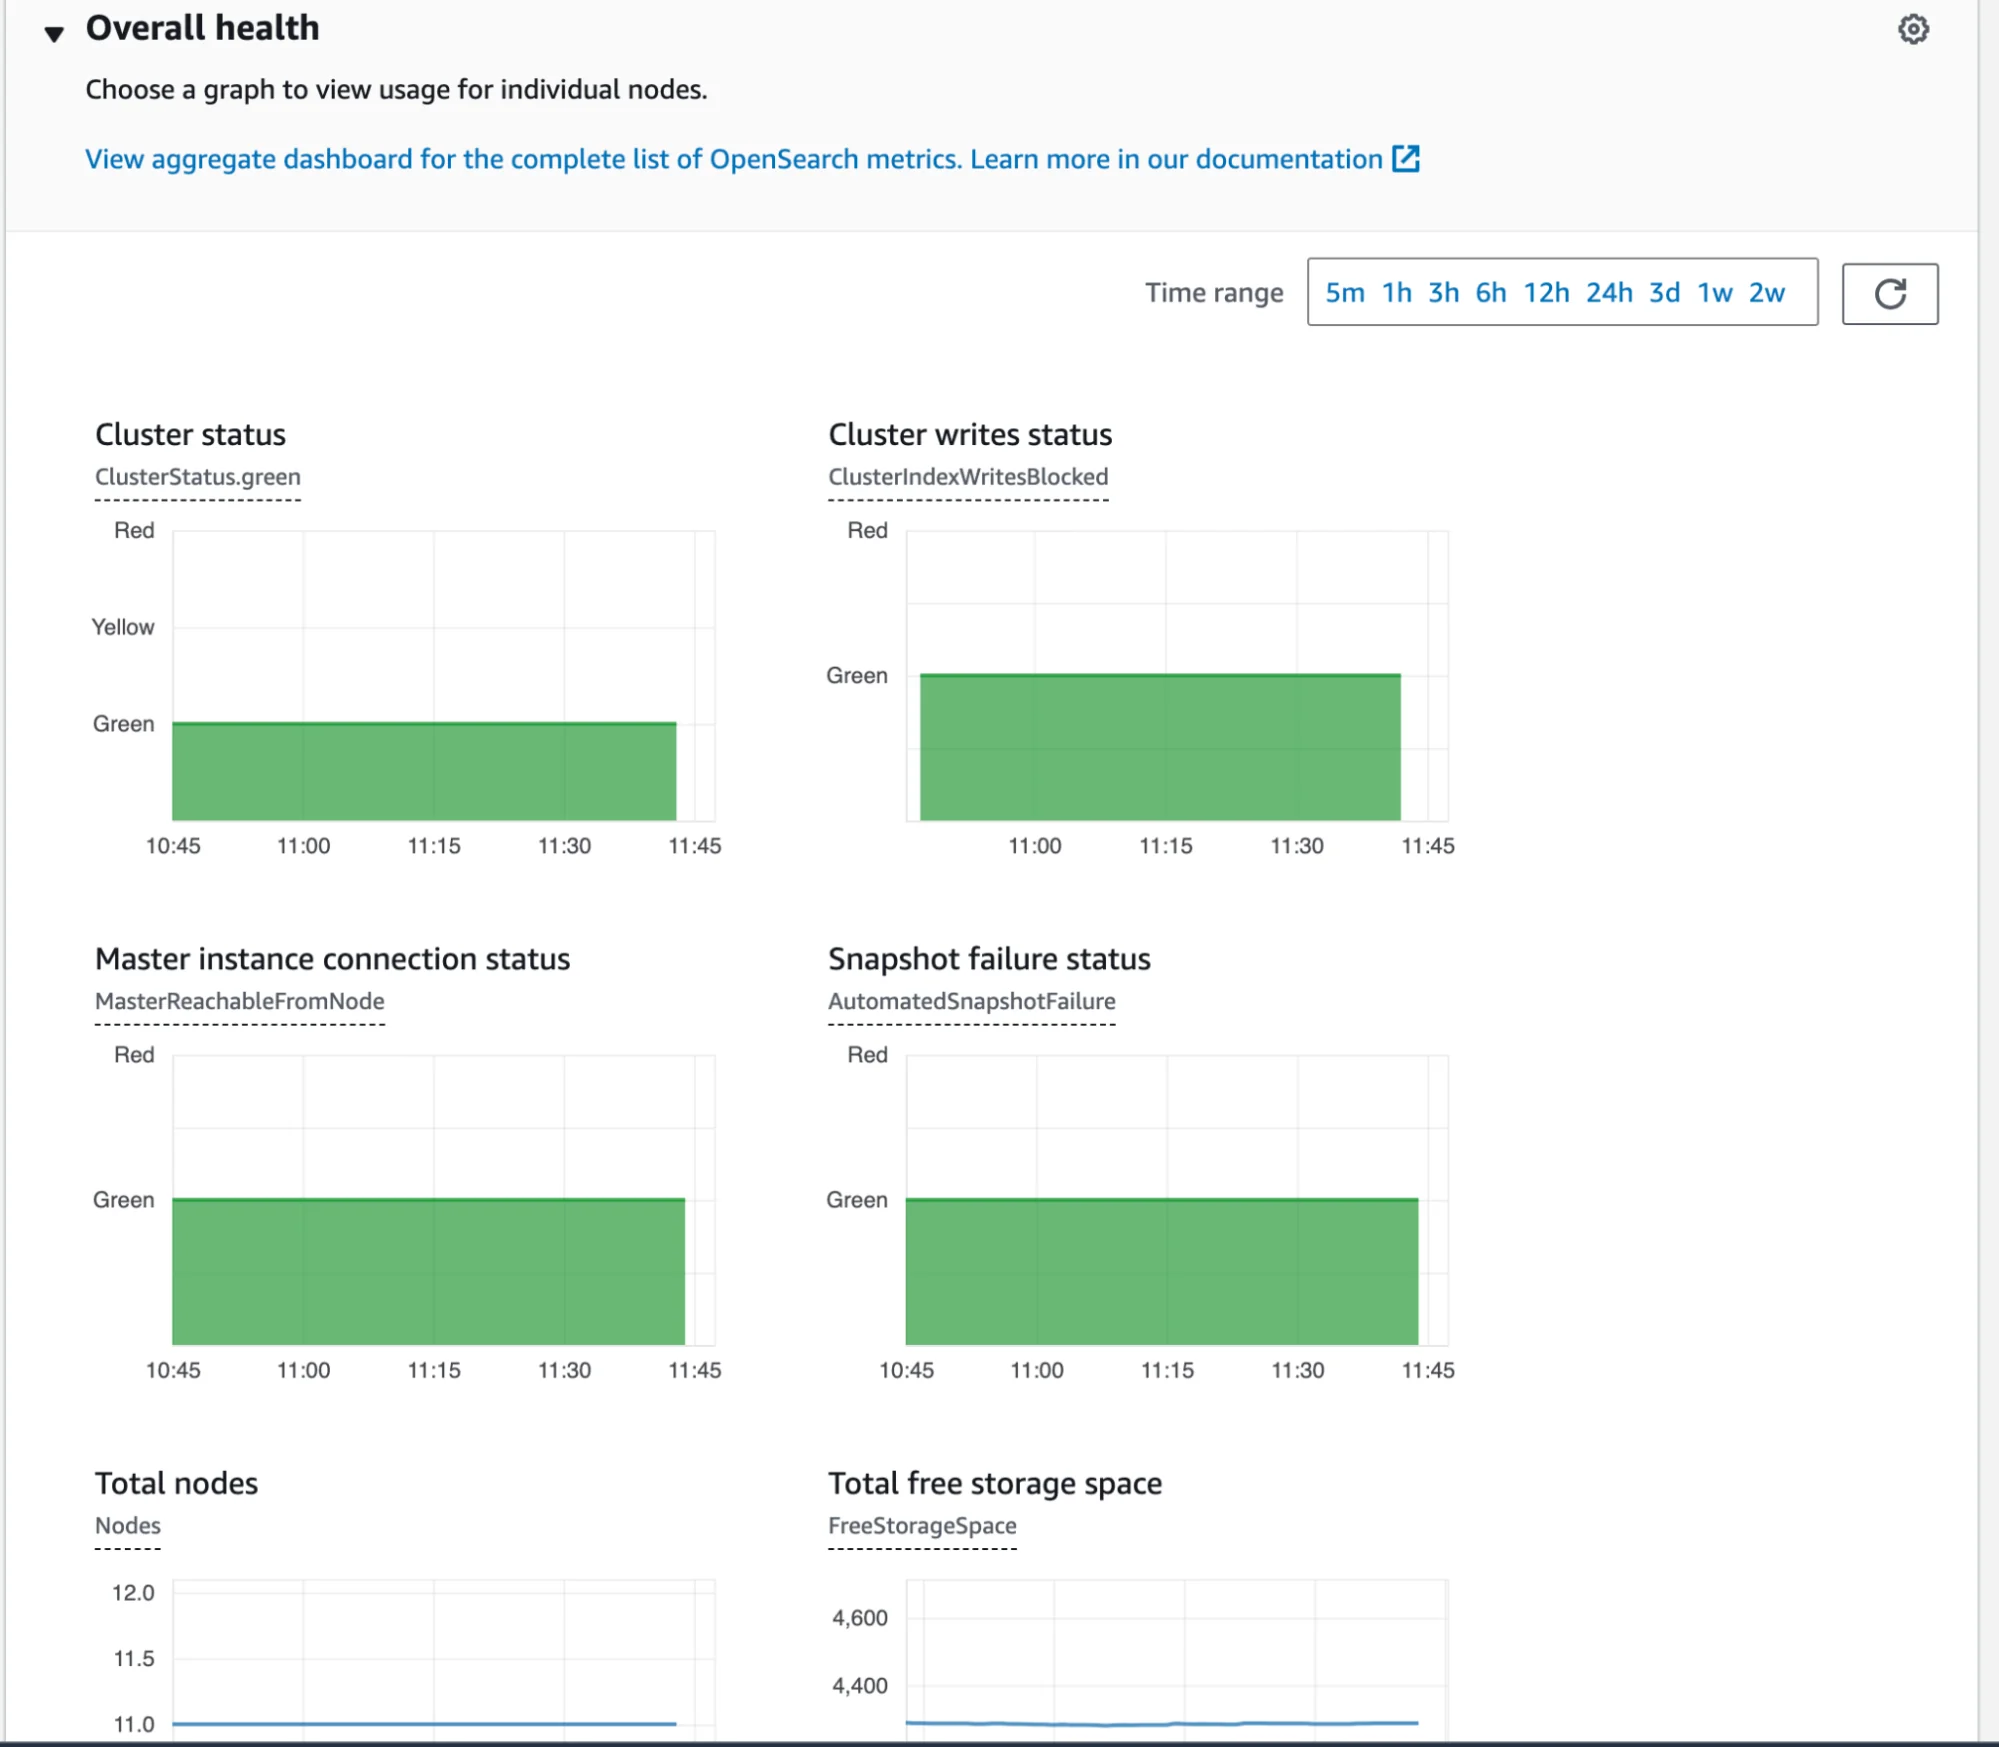
Amazon OpenSearch Service Domains or clusters gets a monitoring dashboard for key metrics. Those are powered by CloudWatch and can be extended as needed.
The built-in dashboards provide detailed insights into OpenSearch cluster health, performance, and stability. Additionally, users can create custom dashboards for specialized metrics and set up alerts to receive notifications of any potential issues.
Pros:
- Provided out of the box.
- Seamless integration with other AWS services and specifically Amazon OpenSearch Service.
- Some service-specific metrics are only available there (for example, EBS disk stats and cluster-wide service blocks).
Cons:
- Built-in dashboards are insufficient, and you need to graph many additional metrics.
- Relatively pricey for any metrics beyond what’s provided out-of-the-box.
- Limited customization compared to some standalone monitoring tools.
2. Grafana and Prometheus
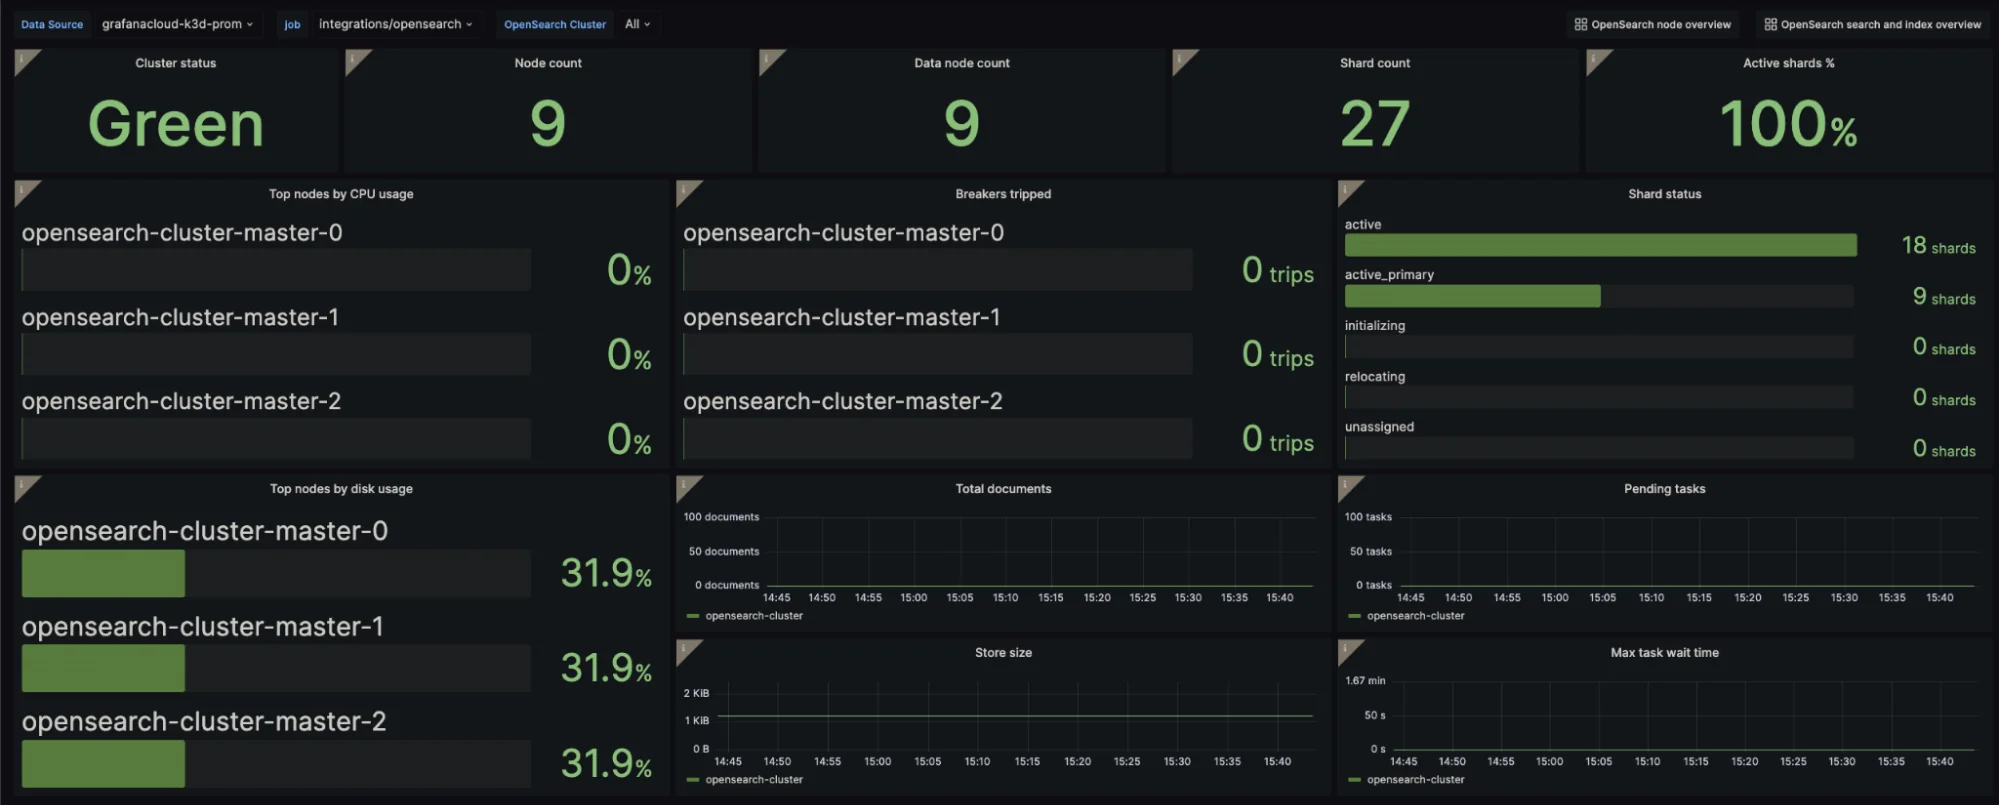
Grafana is an open-source tool for monitoring and visualizing metric data. It seamlessly integrates with various sources and is usually paired with Prometheus, an open-source metrics collection and storage tool. This is a great combination for effectively monitoring and visualizing metric data.
The adaptability and customizable features of Grafana let you craft personalized dashboards and alerts drawing from diverse data sources. You can freely install Grafana as an open-source version for self-maintenance of your cluster health. Alternatively, Grafana Labs provides a hosted version, offering a basic free tier and paid plans catering to increased time series data and storage requirements.
While Grafana may offer a limited array of built-in integrations for alerting, it provides a plugin system that enables users to install plugins that facilitate support for popular alert system targets such as Slack, Teams, PagerDuty, and ServiceNow.
Grafana boasts powerful visualization features, but its integration with Prometheus can be a steep learning curve for some users.
Proficiency in Grafana requires domain expertise to maximize its capabilities and familiarity with integrated systems. For instance, using Prometheus with Grafana involves collecting and exporting metrics, while setting up alerts in Grafana requires knowledge of PromQL syntax, adding complexity to the learning curve.
Pros:
- Flexible dashboarding and visualization.
- Extensive plugin ecosystem.
- Open-source with both self-hosted and hosted options. Cons:
- Steep learning curve, particularly when integrating with Prometheus.
- Requires managing multiple tools for metrics collection and visualization.
3. Datadog
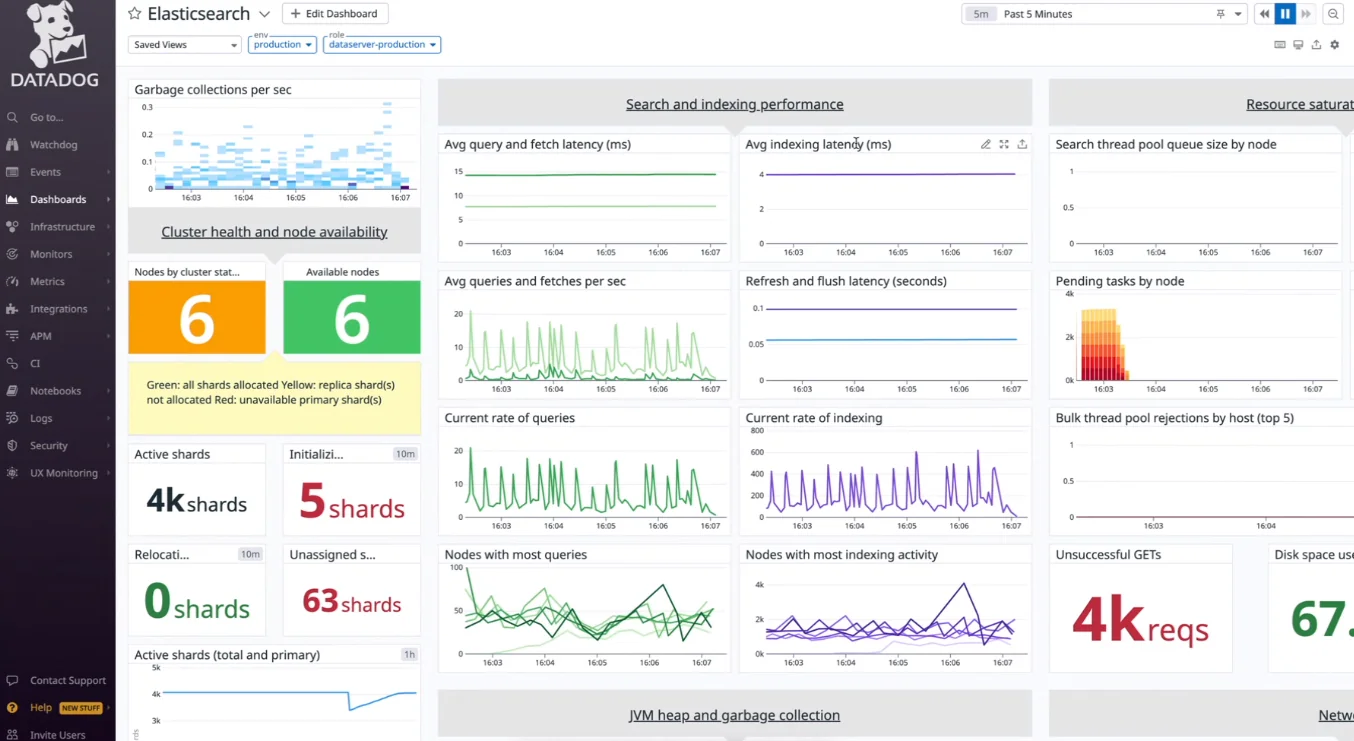
Datadog is a robust enterprise-grade observability tool that offers comprehensive insights into OpenSearch metrics and logs. It supports various integrations for monitoring, visualization, dashboards, tags, and alerts. A notable feature is its templating support, which allows quick access to pre-configured templates for dashboards and reports, simplifying setup and customization. Moreover, Datadog was designed to handle large-scale deployments, making it suitable for enterprises with massive OpenSearch clusters.
The Amazon OpenSearch Service integration requires ingesting CloudWatch metrics and logs into Datadog. This allows for a decent view of cluster metrics and issues. However, not all important metrics are ingested – for example, hot threads and shard balancing data aren’t available on Datadog.
Datadog's main drawback is its high cost, making it one of the priciest monitoring solutions available. It also offers limited customization compared to some alternatives.
In addition, there is a steep learning curve for advanced features. While the interface is user-friendly, mastering some of the more advanced capabilities may require extra training. Despite this, it remains a strong choice for those needing comprehensive monitoring alongside other infrastructure and application monitoring.
Pros:
- User-friendly interface many users know and love.
- Extensive out-of-the-box integrations.
- Allows you to monitor your entire stack in one place, not just OpenSearch. Cons: High cost.
- Limited customization compared to some alternatives.
- Steep learning curve for advanced features.
4. New Relic
New Relic is a popular monitoring platform with powerful tools and dashboards. You can use it for tracking Amazon OpenSearch Service performance and health by following the monitoring integration guide.
New Relic provides real-time observability and detailed insights into your infrastructure, with customizable dashboards and alerts to streamline OpenSearch monitoring. One of its standout features is the comprehensive APM (Application Performance Monitoring) integration. It allows teams to view OpenSearch metrics alongside application performance data, giving a holistic view of system health. New Relic also supports distributed tracing, helping track queries and transactions across complex systems.
On the downside, New Relic’s pricing model is based on data volume, which can quickly become costly for organizations with large OpenSearch clusters or significant volumes of log and trace data. Additionally, while New Relic offers powerful tools, the depth of features may be overwhelming for smaller teams or those with simpler monitoring needs.
Pros:
- Real-time insights and customizable dashboards.
- Comprehensive APM integration for a holistic view of system health.
- Supports distributed tracing for deeper analysis.
- Monitor your entire stack, including OpenSearch, in one place.
Cons:
- Pricing can escalate quickly with larger data volumes.
- Feature-rich platform may feel overwhelming for smaller teams or less complex environments.
- Outdated integration that lacks maintenance, no focus on monitoring OpenSearch clusters.
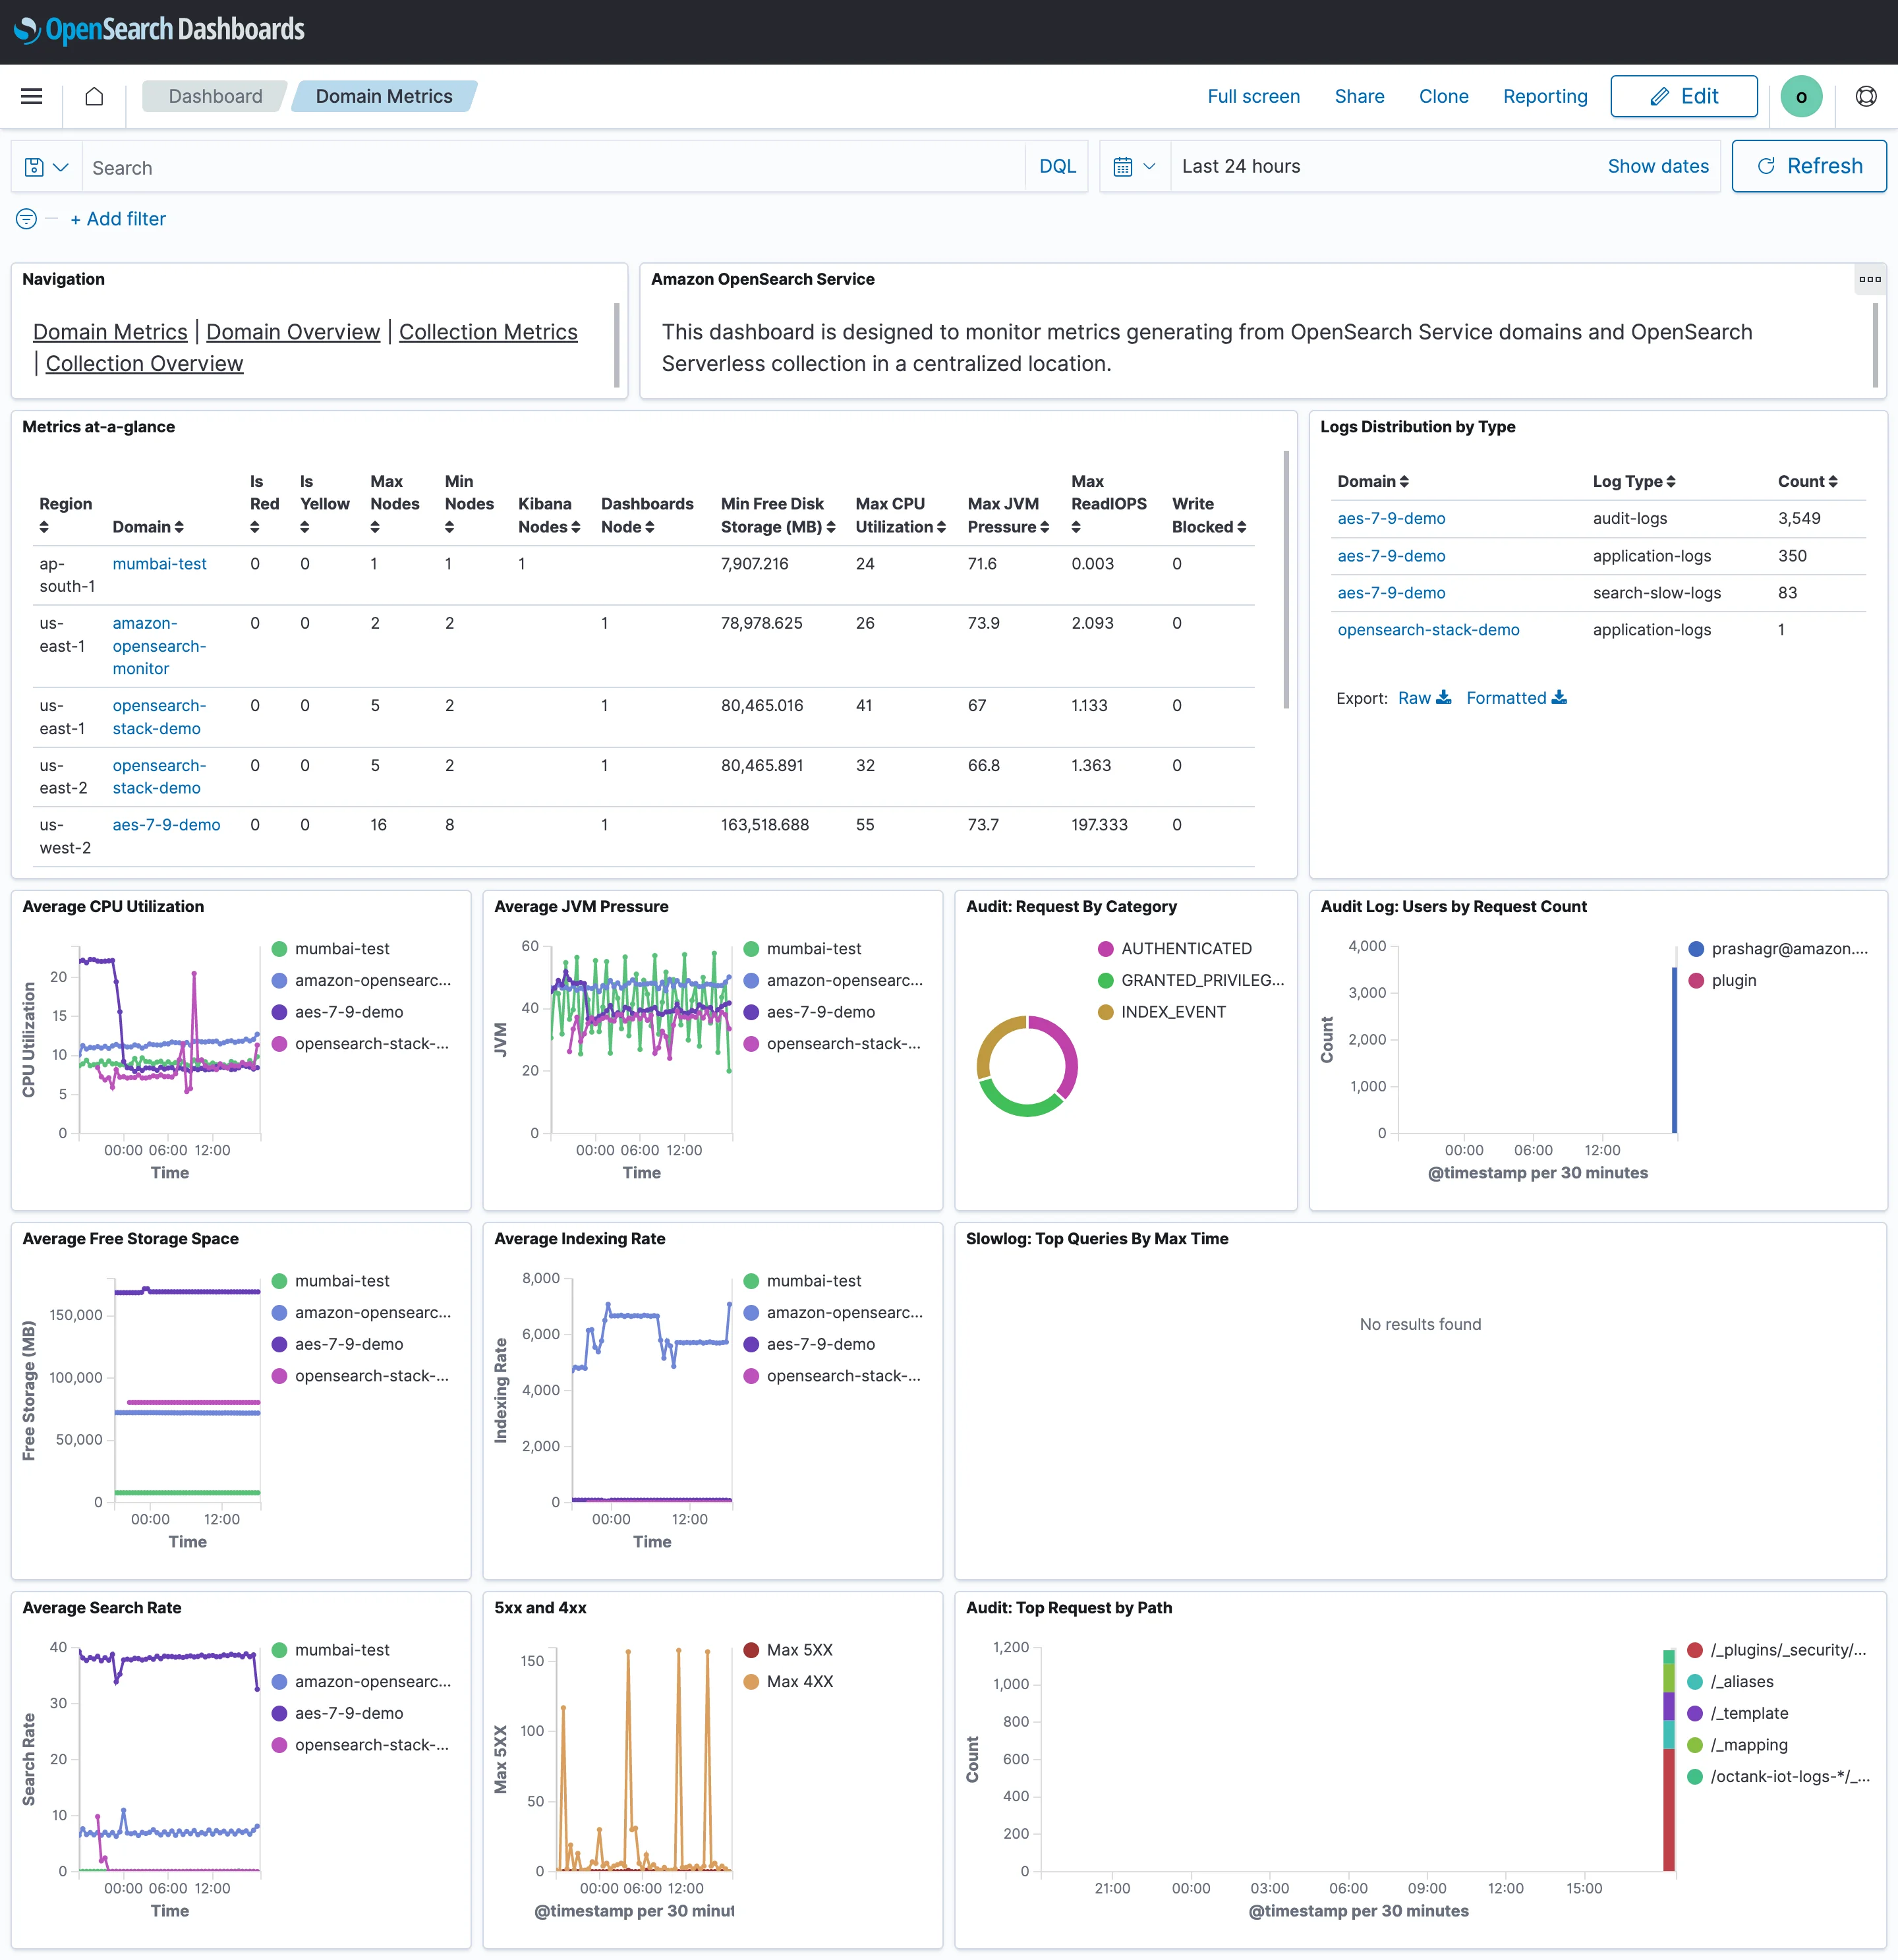
5. Amazon OpenSearch Service Monitor
AWS has provided a step-by-step guide to setting up a monitoring stack for Amazon OpenSearch Service domains and Amazon OpenSearch Serverless collections across all specified regions.
You can configure monitoring for Amazon OpenSearch Service domains and OpenSearch Serverless collections which will fetch the Cloudwatch Metrics and Cloudwatch logs from all domains/collections at a regular interval. This example also comes with pre-built OpenSearch dashboards and Alerts.
Available in this repository.
Pros:
- Pre-built, self-managed.
- Low cost.
Cons:
- Very basic monitoring.
- Very simple and basic alerts.
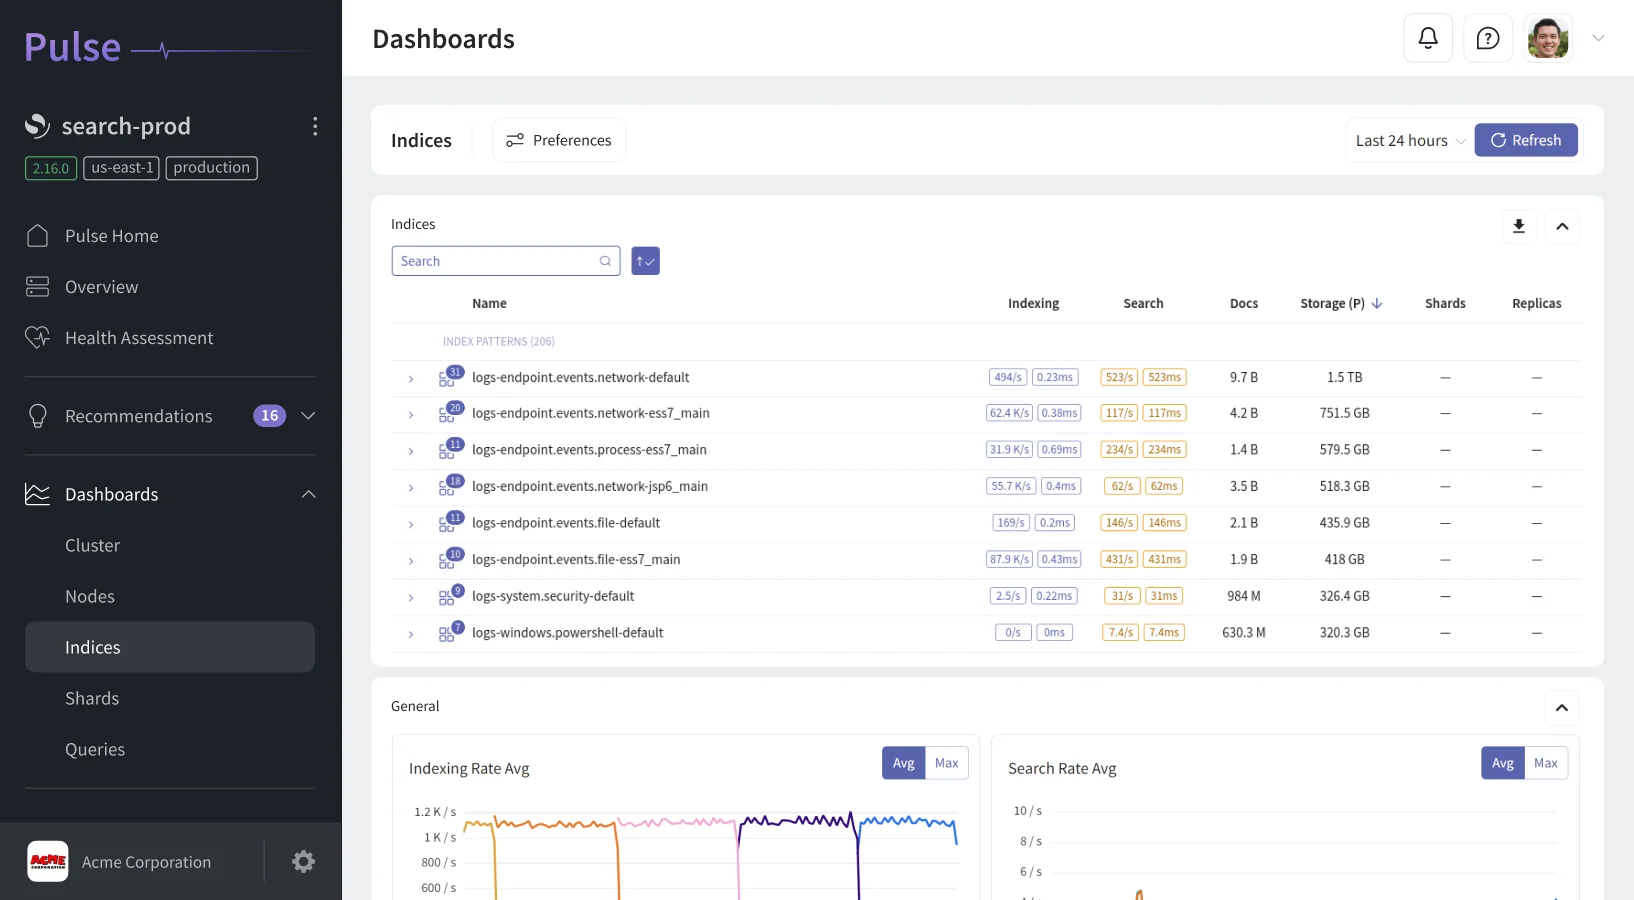
6. Pulse
Pulse is an OpenSearch monitoring solution designed to simplify the management of OpenSearch clusters while efficiently addressing critical issues.
Developed by engineers at BigData Boutique, Pulse learns from your cluster's configuration, unlike tools that use generic thresholds. This means tailored monitoring, dashboards, anomaly detection, and alerts designed to prevent issues before they cause downtime. Pulse focuses on actionable insights, minimizing alert fatigue so you only get notified when it matters.
With insights built from years of hands-on consulting experience, Pulse provides comprehensive visibility into all aspects of your OpenSearch deployment and cluster operations. Its intuitive dashboards showcase cluster, node, and index health, along with pertinent operating system metrics—all prioritized to highlight the most critical information.
Pulse features Query Analytics, empowering users to fine-tune search performance and enhance user experience. For users on premium plans, Pulse includes expert support from experienced OpenSearch engineers, complete with industry-standard SLAs, ensuring rapid resolution of any issues. It also offer broad support, so whether you're debating OpenSearch vs Elasticsearch or managed solutions like Elastic Cloud vs AWS OpenSearch, Pulse monitoring will still work for you.
Pros:
- Powerful and flexible dashboards for tracking cluster health.
- Provides actionable insights and anomaly detection to prevent future issues.
- Simple to set up and use.
- Expert support as part of the product offering.
Cons:
- No free or open-source option.
- Limited to OpenSearch and relevant OS metrics.
- Does not integrate with other monitoring tools.
How to Choose the Best OpenSearch Monitoring Tool
Excellent solutions are available for OpenSearch monitoring, ranging from free options to commercial licenses. Choosing the right one depends on personal preference and specific requirements.
Due to our extensive experience with OpenSearch and after using many different tools over the years, we developed and currently use Pulse for most use cases. We recommend Pulse for its comprehensive monitoring and alerting capabilities that provide actionable insights for OpenSearch cluster management.
Alternatively, CloudWatch offers seamless integration with OpenSearch for users already leveraging AWS services, providing a robust monitoring solution within the AWS ecosystem.
Grafana is an excellent free and open-source monitoring solution for those prioritizing cost. However, if budget is not a concern and you seek a comprehensive observability platform covering OpenSearch clusters, applications, logs, and metrics, consider Datadog.
Wrap up
We hope this guide helps you make the best decision regarding your OpenSearch monitoring needs, both today and in the future. If you happen to be looking for Elasticsearch monitoring, here’s a comprehensive guide to the available tooling: Elasticsearch Monitoring: Selecting the Ideal Tool
Supporting both Elasticsearch and OpenSearch, Pulse optimizes performance, reduces costs, and aligns with your requirements, helping your team save time managing clusters and focus on innovation instead. If your team needs hands-on guidance picking and operating the right monitoring stack, explore our OpenSearch consulting services.