Shira Drori
A practical comparison of Elasticsearch monitoring tools - from Kibana Stack Monitoring and Grafana to Pulse, New Relic, and Datadog - covering features, pricing, and trade-offs for production clusters.
Elasticsearch powers search, observability, SIEM, and increasingly vector search workloads across thousands of production deployments. With Elasticsearch 8.x and the upcoming 9.x release bringing architectural changes - from the Elastic Agent-based monitoring pipeline to Lucene 10 under the hood - keeping clusters healthy requires tooling that actually understands what it is monitoring.
Elasticsearch monitoring is the practice of continuously collecting and analyzing cluster health metrics, node-level JVM and OS statistics, and index-level performance data to detect problems before they cause downtime. A good monitoring setup covers three layers: cluster and index metrics (shard health, search latency, indexing throughput), JVM and OS metrics (heap pressure, GC pauses, CPU, disk I/O), and alerting that translates metric anomalies into actionable steps.
This post compares six monitoring tools we have used across production clusters, covering what each does well, where it falls short, and what it costs.
Quick Comparison
| Tool | Type | Cost | ES-Specific | Historical Data | Alerting | Multi-Cluster |
|---|---|---|---|---|---|---|
| Kibana Stack Monitoring | Built-in | Free (basic), paid tiers | Yes | Yes | Yes (paid) | Limited |
| Cerebro | Open-source | Free | Yes | No | No | No |
| Grafana + Prometheus | Open-source | Free (self-hosted), paid cloud | No (via exporter) | Yes | Yes | Yes |
| New Relic | SaaS | $0.30/GB + $49/user/mo | Via integration | Yes | Yes | Yes |
| Datadog | SaaS | $15/host/mo (infra) | Via integration | Yes | Yes | Yes |
| Pulse | SaaS | Paid plans | Yes (purpose-built) | Yes | Yes | Yes |
Elasticsearch Monitoring Tools
1. Elastic's Stack Monitoring in Kibana
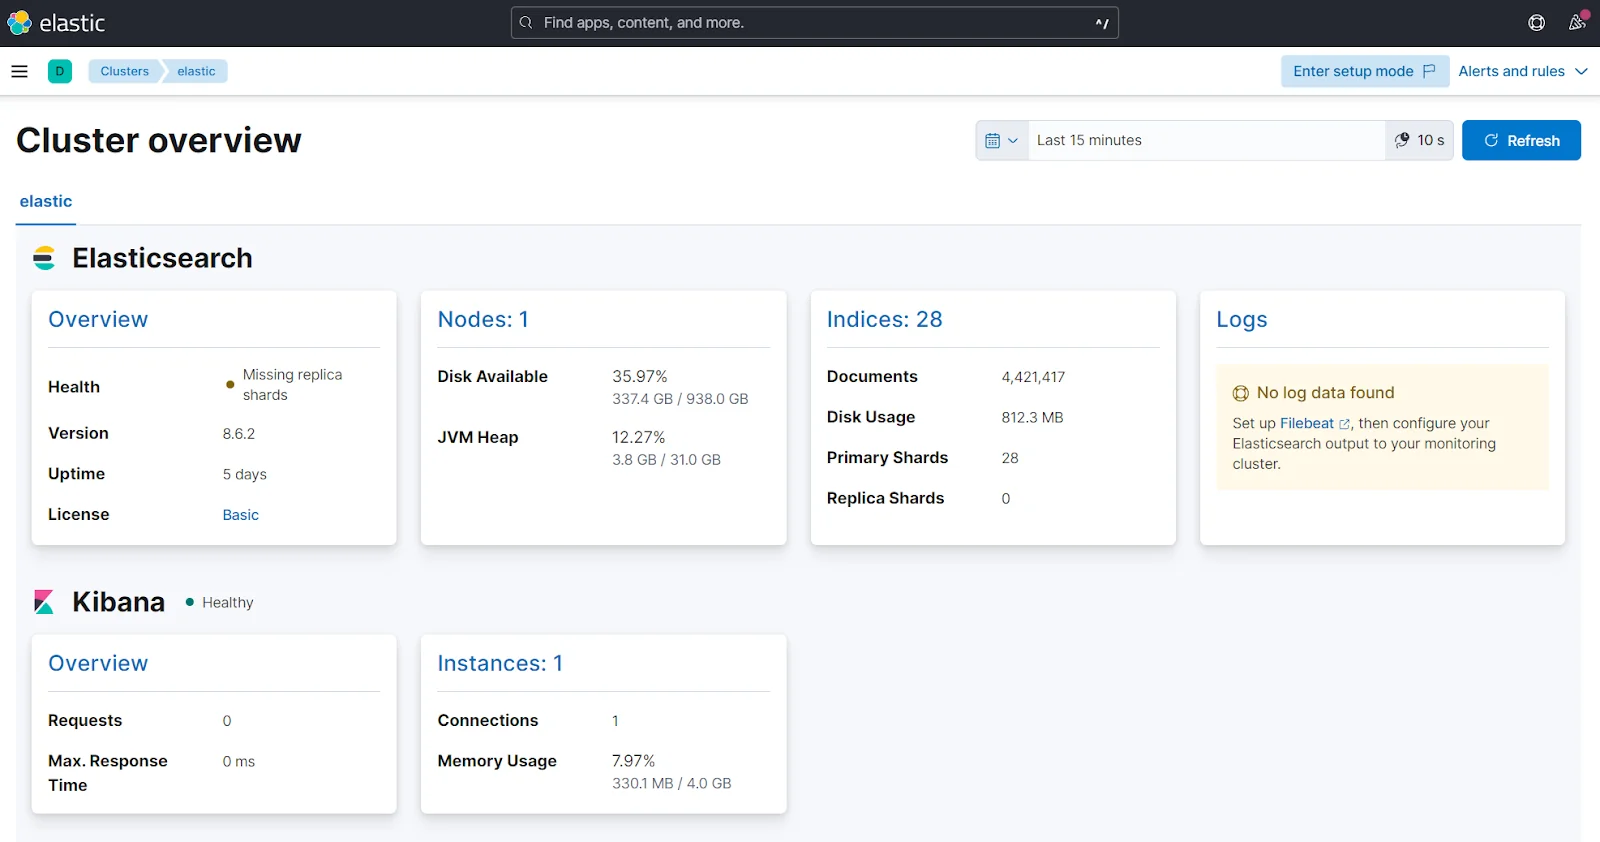
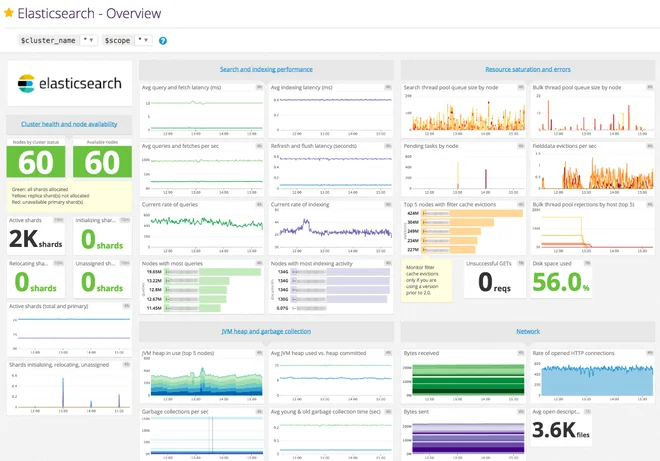
Elastic's Stack Monitoring application ships with Kibana and provides native visibility into Elasticsearch cluster performance. In Elasticsearch 8.x and later, Elastic recommends collecting monitoring data via the Elastic Agent rather than the legacy Metricbeat or internal collection methods, which simplifies setup but ties you further into the Elastic ecosystem.
Stack Monitoring provides detailed metrics including search and indexing rates, disk usage, JVM heap usage, and CPU utilization through customizable dashboards. See the complete list of available metrics. Advanced alerting and cross-cluster monitoring require a paid subscription - check the Elastic subscriptions page for current tier differences.
One practical limitation: each resource (node, index) can only be viewed individually. You cannot overlay all node metrics on a single dashboard screen, which makes it harder to spot imbalanced clusters at a glance.
Pros:
- Native integration - no additional agents or exporters needed (with Elastic Agent in 8.x+)
- Integrations with Slack, Jira, and ServiceNow for alerting
- Active community support
Cons:
- Advanced alerting and cross-cluster features require a paid subscription
- Per-node views limit quick cluster-wide comparisons
- Monitoring data stored in the same cluster can add load (unless using a dedicated monitoring cluster)
2. Cerebro
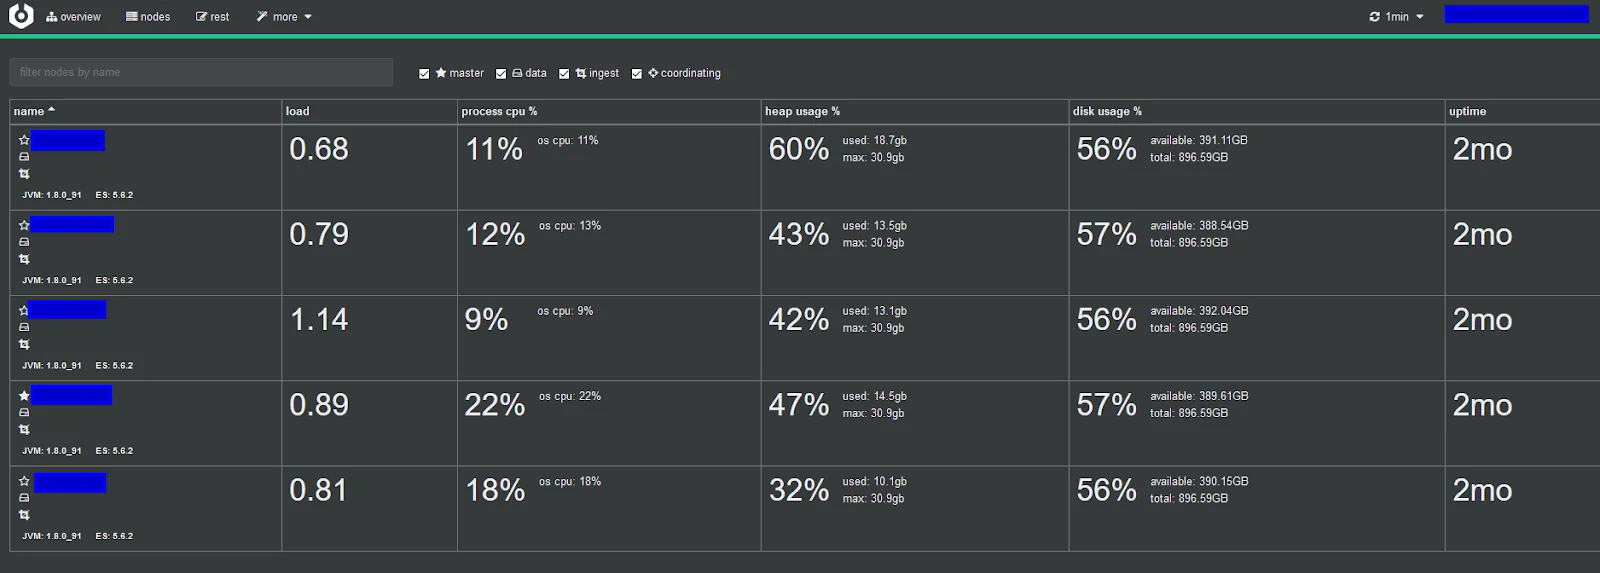
Cerebro is a lightweight, free, open-source monitoring tool that gives a clean snapshot of Elasticsearch cluster health. It shows shard allocation, index status, and node state in a simple web UI without configuration overhead.
The most significant limitation is the lack of historical data - Cerebro only shows the current state. There is no alerting, no trend analysis, and no integration with external notification systems.
More importantly, Cerebro has not been actively maintained for nearly five years. The latest commit in its GitHub repository was in July 2021, and it lacks support for Elasticsearch 8.x or 9.x authentication and security features. It remains useful for quick cluster health checks on older clusters, but it is not a viable long-term monitoring solution.
Pros:
- Free and open-source
- Lightweight, fast to set up
Cons:
- No historical data or trend analysis
- No alerting or external integrations
- Effectively abandoned - no ES 8.x/9.x support
- No longer suitable as a primary monitoring tool
3. Grafana and Prometheus
Grafana paired with Prometheus is the go-to open-source monitoring stack for teams that already run infrastructure monitoring. The elasticsearch_exporter collects cluster, node, and index metrics and exposes them as Prometheus targets.
The combination is powerful: Grafana's dashboarding is highly customizable, Prometheus handles metric storage and querying via PromQL, and the plugin ecosystem supports alerting to Slack, PagerDuty, Teams, and ServiceNow. Pre-built Elasticsearch dashboards are available on the Grafana dashboard marketplace.
The trade-off is complexity. You are managing three components (exporter, Prometheus, Grafana), writing PromQL for alerts, and maintaining retention policies. None of these components understand Elasticsearch semantics - they see numbers, not cluster health. You need Elasticsearch domain expertise to decide what thresholds matter and what to alert on.
Grafana Cloud offers a hosted option with a free tier (10k metrics series, 50GB logs) and paid plans for larger deployments.
Pros:
- Flexible dashboarding and visualization
- Extensive plugin ecosystem
- Open-source with self-hosted and hosted options
- Works well if you already run Prometheus for other services
Cons:
- Steep learning curve, especially PromQL for alerting
- Requires managing multiple tools
- No built-in Elasticsearch awareness - you build the intelligence yourself
4. New Relic
New Relic is a full-stack observability platform with a native Elasticsearch integration that pulls cluster, node, and index metrics automatically. For teams already using New Relic for APM or infrastructure monitoring, adding Elasticsearch visibility is straightforward.
New Relic provides access to nearly all available cluster statistics, with dashboarding, alerting, and NRQL (New Relic Query Language) for custom queries across your monitoring data.
Pricing follows a usage-based model: $0.30/GB for data ingest beyond the free 100GB/month, plus per-user costs ($49/user/month for Core users, higher for Full Platform users). The free tier works for evaluation, but production clusters with meaningful data volumes will hit paid thresholds quickly.
Pros:
- Full-featured observability platform covering infra, APM, and logs alongside Elasticsearch
- Native Elasticsearch integration with automatic metric collection
Cons:
- Usage-based pricing can escalate with high-cardinality Elasticsearch metrics
- Limited Elasticsearch-specific intelligence - alerts and dashboards are generic
5. Datadog
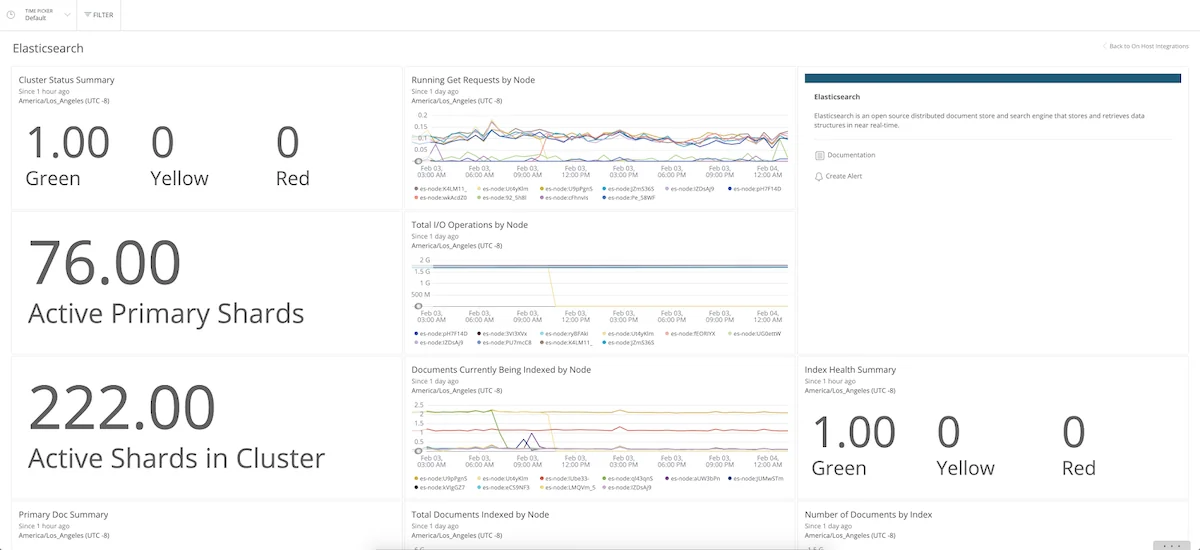
Datadog offers a mature Elasticsearch integration with pre-built dashboards, anomaly detection, and out-of-the-box templates that reduce initial setup time. Like New Relic, it is an enterprise-grade observability platform that covers infrastructure, APM, logs, and more.
Datadog's Elasticsearch integration tracks cluster health, JVM metrics, search/indexing latency, and thread pool activity. The templating system is a practical advantage: pre-configured dashboards for Elasticsearch are available immediately, rather than requiring manual setup.
Pricing starts at $15/host/month for infrastructure monitoring and $31/host/month with APM. Log management and additional features are billed separately. For large Elasticsearch deployments with many nodes, costs accumulate per host.
Pros:
- Pre-built Elasticsearch dashboards and templates
- User-friendly interface
- Strong anomaly detection and ML-based alerting
Cons:
- Per-host pricing adds up for large clusters
- Elasticsearch-specific depth is limited compared to purpose-built tools
6. Pulse
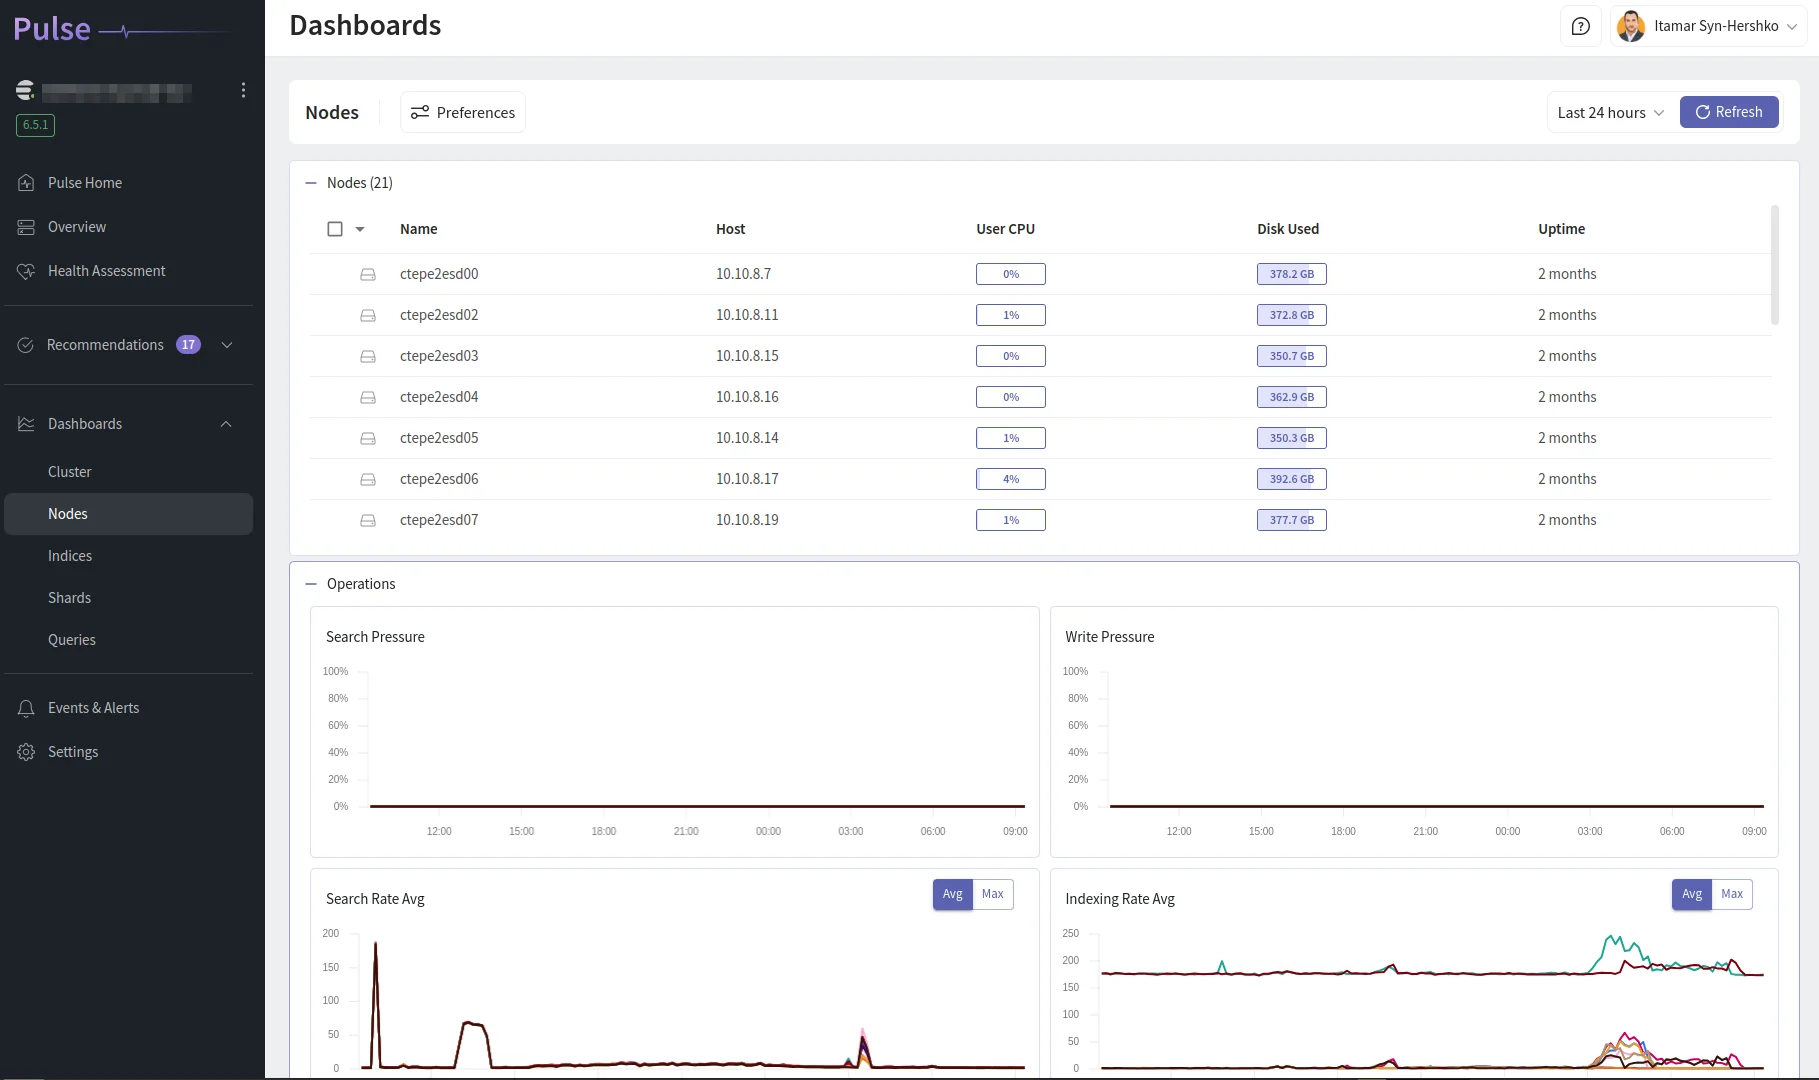
Pulse, developed by the engineers at BigData Boutique, is purpose-built for Elasticsearch and OpenSearch monitoring. Where general-purpose tools show you metrics and leave interpretation to you, Pulse is designed to translate cluster behavior into actionable recommendations.
Pulse provides a single pane of glass across multiple clusters, including multi-cloud and hybrid deployments. It supports all Elasticsearch versions from 7.x through 9.x, running anywhere - on-premises, cloud-managed, or self-hosted. The dashboards cover clusters, nodes, indices, and underlying OS metrics, drawing on years of Elasticsearch consulting experience to surface the metrics that actually matter.
A key differentiator is automated root cause analysis. Rather than firing generic threshold alerts, Pulse analyzes metric patterns and suggests specific causes and remediation steps. This reduces the Elasticsearch expertise required to respond to incidents and cuts mean time to resolution.
Pulse also includes Query Analytics for analyzing Elasticsearch query performance - identifying slow and expensive queries, tracking query patterns over time, and pinpointing optimization opportunities. Expert support from Elasticsearch engineers with industry-standard SLAs is included.
Pros:
- Purpose-built for Elasticsearch and OpenSearch with deep domain awareness
- Single pane of glass for multi-cluster, multi-cloud, and hybrid environments
- AI-powered root cause analysis with actionable recommendations
- Query Analytics for search performance optimization
- Expert support included
Cons:
- No free or open-source option
- Focused on Elasticsearch/OpenSearch - not a general infrastructure monitoring tool
Key Metrics Every Elasticsearch Monitoring Setup Should Track
Regardless of which tool you choose, these are the metrics that matter most in production:
- Cluster status (green/yellow/red): Red means at least one primary shard is unassigned. Yellow means replicas are missing. Green means all shards are allocated. Any tool that does not alert on non-green status is incomplete.
- JVM heap usage and GC pressure: Elasticsearch runs on the JVM, and heap pressure is the most common cause of performance degradation. Monitor heap usage percentage and GC pause duration. Sustained heap above 75% signals trouble. See our guide on Elasticsearch heap size tuning for specifics.
- Search and indexing latency: Track p50 and p99 latency for both search and indexing operations. Latency spikes often correlate with GC pauses, merge storms, or resource contention. Read more on monitoring query performance.
- Thread pool rejections: Rejections on the
search,write, orbulkthread pools indicate the cluster is overwhelmed. Even a small number of rejections deserves investigation. - Disk watermarks: Elasticsearch stops allocating shards at the high watermark (default 90%) and becomes read-only at the flood stage (95%). Monitor disk usage per node relative to these thresholds.
- CPU and memory at the OS level: JVM metrics alone are not enough. OS-level CPU saturation and memory pressure (especially swap usage) affect cluster stability directly.
For a deeper dive into query-level performance, see our post on expensive queries in Elasticsearch and OpenSearch.
Our Recommendations
Good Elasticsearch monitoring solutions exist at every price point, from free open-source tools to commercial platforms.
From our extensive experience with Elasticsearch and after using many of these tools across production clusters, we built and use Pulse for most use cases. Its combination of Elasticsearch-specific intelligence, multi-cluster support, and automated root cause analysis saves significant operational time.
For teams already on the Elastic Stack, Kibana's Stack Monitoring covers the basics well - especially when running Elastic Cloud where the monitoring infrastructure is managed for you.
Grafana and Prometheus are the right choice for teams that already run Prometheus and want to consolidate Elasticsearch monitoring into their existing stack. Plan for the setup and PromQL learning curve.
If budget is not a constraint and you need a single platform covering Elasticsearch alongside applications, logs, and infrastructure, New Relic and Datadog both do the job. Pick whichever your team already knows.