Efrat Lehman Dahan
Detect, analyze and resolve the source of slowness in your Elasticsearch and OpenSearch clusters.
Do you often find yourself grappling with the frustration of poor query performance? Trying to figure out the root cause of a problem can be exhausting, resource-consuming, and impact your customers' experience and the company revenue.
Pulse introduces its revolutionary Query Analytics feature, designed to alleviate your query-related woes and empower you with comprehensive insights for optimal system efficiency.
The feeling of being lost and uncertain about where to begin addressing query performance issues is all too familiar. It's like navigating through a maze of interconnecting events, where a seemingly innocent Kibana dashboard or an insignificant cluster hiccup sometimes go unnoticed but can suddenly take the entire stack down. Such problems not only affect production but also disappoint your customers and significantly influence your cloud bill.
Pulse our innovative platform already goes beyond the traditional approach of endlessly staring at dashboards and analyzing individual queries. With Pulse you get a holistic view of your cluster's performance, including indexes, nodes, and shards, and now with the one-of-a-kind Query Analytics feature that aids in identifying and resolving query issues. With Pulse’s Query Analytics for Elasticsearch and OpenSearch, you gain access to a powerful platform that was never seen before in Elasticsearch developer tools.
Utilize patterns to identify trends
One of the key features of Query Analytics is the ability to identify query patterns, and analyze “families” of queries to identify culprits. Instead of being confronted with a myriad of individual queries that share similar mistakes that using the same instructor, Pulse’s Query Analytics enables you to effectively detect patterns and correlate those to latency and other key metrics. This holistic approach facilitates a deeper understanding of the underlying issues and paves the way for comprehensive and faster optimization processes.
Comprehensive Query Statistics
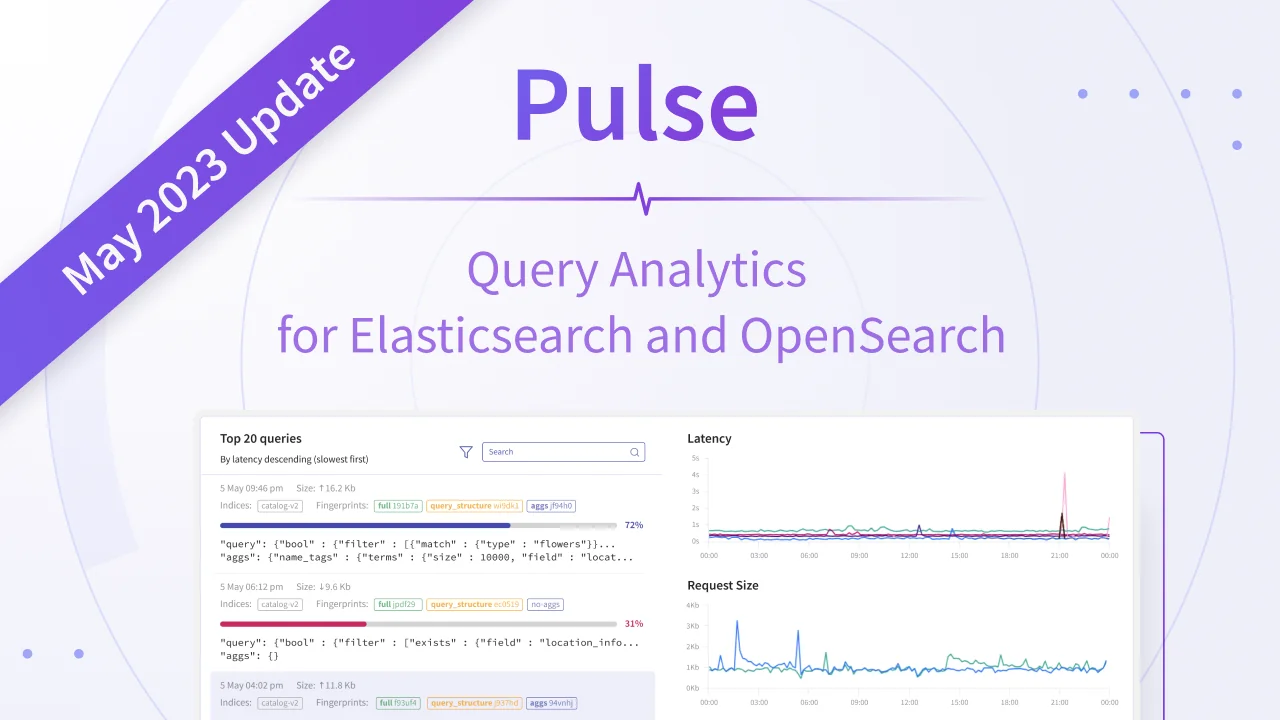
By providing detailed query statistics and analytics, Pulse is enabling you to understand trends, identify the slowest indices, and gain insights and recommendations regarding query execution time, CPU usage, data read and written, and more. Breakdown charts based on indices, users, and other parameters provide you with valuable information to identify optimization opportunities and enhance query performance.
Slow logs - no more
Slow logs are a typical example of looking under the lamppost, as they will be full of query logs when the cluster is busy, maybe for other unrelated reasons. To really understand what’s going on in your cluster, a thorough analysis of all queries has to be performed. Pulse is revolutionizing the way faulty queries are found and fixed.
Interactive Timeline
Easily browse, search, filter, and visualize queries using an interactive timeline. Whether you need real-time query monitoring or want to investigate past queries, Pulse provides a user-friendly interface for efficient navigation through query data. Locate specific queries based on various criteria and delve deeper into their characteristics.
Identifying Resource-Intensive Queries
Uncover the heavy spenders that consume a significant portion of your cluster's CPU. Pulse's Query Analytics helps you identify users and indices that contribute most to resource usage in terms of CPU and I/O, the successful and the failed queries, queries with too many buckets, cardinality aggregations and more. Armed with this information, you can take necessary steps to scale resources wisely, eliminate bottlenecks and educate your developers for more efficient code.
Correlate with cluster metrics
The new Query Analytics feature is just a new shiny feature in a much bigger, holistic system with the ultimate goal of continuously optimizing your Elasticsearch and OpenSearch clusters. Correlate system events with slow queries, to be able to do a proper root cause analysis.
Get Started with Pulse
Pulse Query Analytics opens the door to a new era of query performance optimization of the Elasticsearch and OpenSearch. By gaining a deeper understanding of your cluster's efficiency and leveraging insights into query patterns and resource consumption, you can proactively address issues and deliver improved results. Embrace Pulse Query Analytics and experience a transformative journey towards faster, more efficient queries and enhanced overall system performance.
Don't have a Pulse account yet? Contact us to get started.