In this blog post, we'll review the available Elasticsearch monitoring tools, aiming to offer a comprehensive guide to help you choose the perfect tool for monitoring your OpenSearch clusters.
Elasticsearch is one of the most popular software tools in the industry, revered for its multifaceted functionality spanning Search, as well as Observability, Security Information and Event Management (SIEM), and in recent Elasticsearch versions, even as a Vector Database. The result is that Elasticsearch has become a critical part of the software stack of many companies.
With its key part of the software stack, maintaining the stability and peak performance of Elasticsearch clusters is paramount. Achieving this goal necessitates robust monitoring solutions tailored specifically for Elasticsearch. In this blog post, we’ll delve into the monitoring tools available, aiming to provide a detailed roadmap for selecting the ideal tool for monitoring your Elasticsearch clusters.
What Makes a Good Elasticsearch Monitoring Tool?
Before diving into the evaluation of Elasticsearch monitoring tools, it's essential to delineate the key attributes that define an ideal monitoring solution for Elasticsearch clusters:
Comprehensive Monitoring Scope: An effective monitoring tool should encompass the Elasticsearch process, the underlying operating system, and the Java Virtual Machine (JVM) hosting Elasticsearch. This comprehensive approach ensures a holistic understanding of the cluster's health and performance.
Feature-rich Capabilities: The ideal monitoring tool should offer a wide array of features, including the collection of operating system metrics such as CPU and RAM usage, JVM metrics like heap usage and Garbage Collection (GC) count, as well as cluster metrics such as query response times and index sizes. Additionally, the tool should facilitate the creation of alerts, visualizations, and dashboards for comprehensive monitoring.
Scalability and Cost-effectiveness: Scalability is crucial to accommodate the growth of Elasticsearch clusters, while cost-effectiveness ensures that monitoring solutions remain viable for organizations of all sizes.
Now, let's explore some of the prominent Elasticsearch monitoring tools available in the market:
Elasticsearch Monitoring Tools
1. Elastic’s Stack Monitoring in Kibana
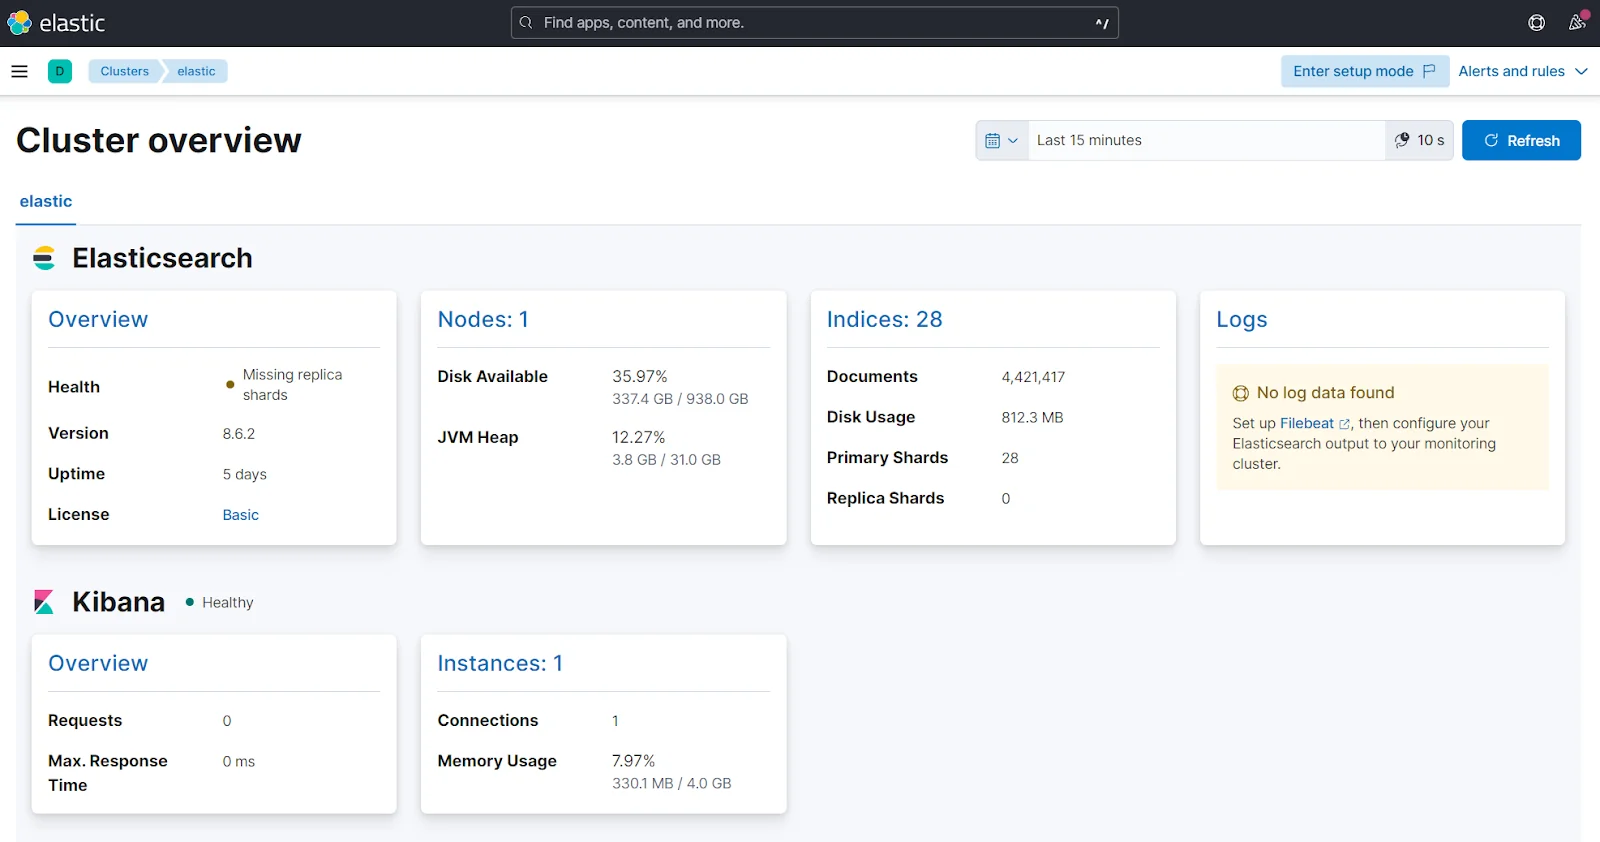
Elastic's Stack Monitoring application, seamlessly integrated into Kibana, emerges as a compelling option due to its inherent compatibility with the Elastic Stack ecosystem. Stack Monitoring provides invaluable insights into Elasticsearch clusters' performance by offering monitoring, alerting, and dashboarding capabilities. While basic features are free, certain advanced functionalities require a paid subscription, necessitating a careful evaluation of organizational needs. To view more of the differences between the free and paid versions of Kibana, check the official Elastic site.
Stack Monitoring empowers users with detailed metrics, including search and indexing rates, disk usage, JVM heap usage, and CPU utilization, presented through customizable dashboards. See the complete list of the available metrics. However, there are many usability limitations; for example, while each resource (node, index) can be viewed individually, you are unable to view the metrics of all nodes on a single dashboard screen.
In addition, Stack Monitoring has integrations with popular tools such as Slack, Jira, and ServiceNow.
Pros:
- Integration with popular tools such as such as Slack, Jira, and ServiceNow.
- Comprehensive metrics and customizable dashboards.
- Active community support.
Cons:
- Some advanced features require a paid subscription.
- Usability limitations may hinder user experience (for example, node graphs are shown individually, never on one graph).
2. Cerebro
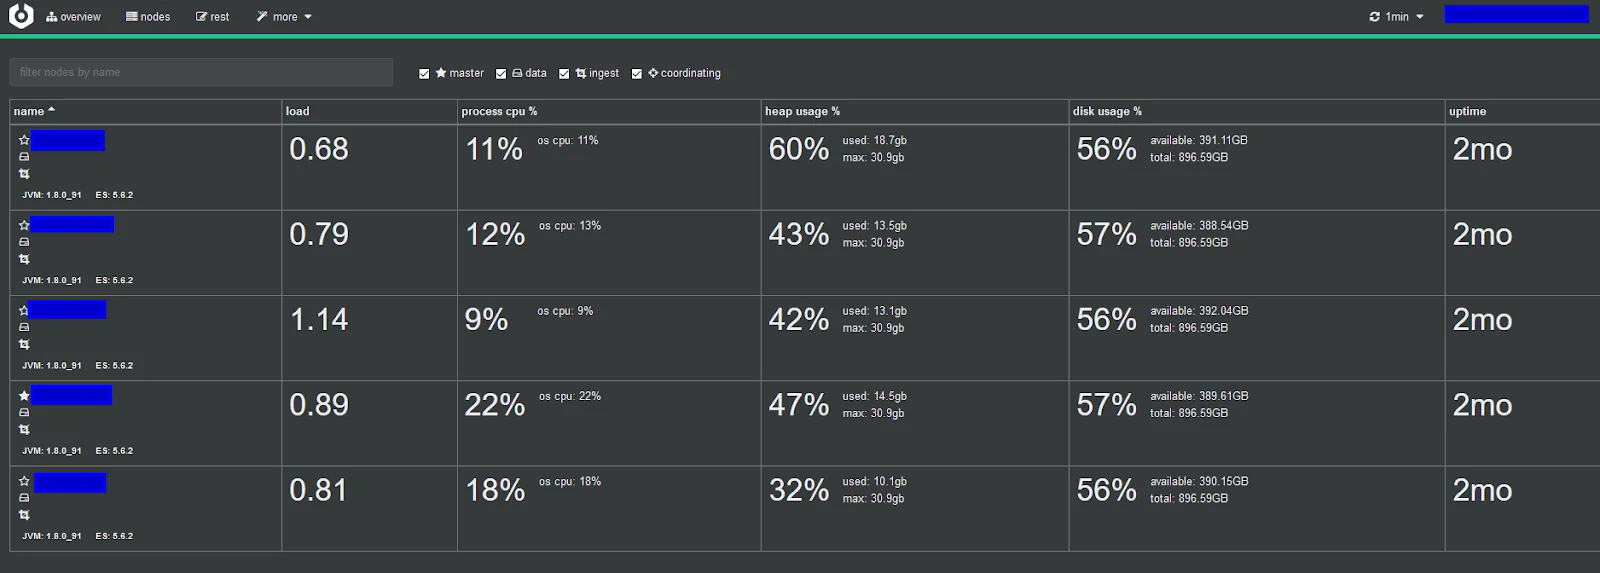
Cerebro is a well-known, lightweight, free, and user-friendly open-source monitoring tool. While Cerebro lacks some advanced features, this isn't necessarily a drawback, as it provides a straightforward view of your Elasticsearch cluster without unnecessary distractions or features that might only sometimes be essential.
Cerebro offers a clear snapshot of Elasticsearch cluster health in real time. However, its most significant drawback is its inability to display historical data. In addition, the absence of alerting functionalities may limit its utility for comprehensive monitoring needs.
Cerebro’s infrequent updates raise concerns about long-term viability. The latest commit from its GitHub repository was on July 3, 2021, over two years ago at the time of writing! That said, it is still a great lightweight, free, and open-source alternative to some larger players in this space.
- Pros:
- Free and open-source
- Lightweight and easy to use.
Cons:
- Not as powerful or flexible
- No option for viewing historical data
- No integration with other tools
- No longer actively supported
3. Grafana and Prometheus
Grafana, an open-source tool, specializes in monitoring and visualizing metric data, seamlessly integrating with various sources and commonly paired with Prometheus, an open-source metrics collection and storage tool. This collaboration forms a potent combination for monitoring and visualizing metric data effectively.
Its adaptability and customizable features empower users to craft personalized dashboards and alerts, drawing from diverse data sources. Grafana can be freely installed as an open-source version for self-maintenance. Alternatively, Grafana Labs provides a hosted version, offering a basic free tier and paid plans catering to increased time series data and storage requirements.
While Grafana may not offer an extensive array of built-in integrations for alerting, it provides a plugin system enabling users to install plugins facilitating support for popular alert system targets such as Slack, Teams, PagerDuty, and ServiceNow.
Although Grafana boasts powerful visualization features, its integration with Prometheus can present a steep learning curve for some users. Proficiency in Grafana requires domain expertise to maximize its capabilities and familiarity with integrated systems. For instance, utilizing Prometheus with Grafana involves collecting and exporting metrics, while setting up alerts in Grafana requires knowledge of PromQL syntax, adding complexity to the learning curve.
Pros:
- Flexible dashboarding and visualization.
- Extensive plugin ecosystem.
- Open-source with both self-hosted and hosted options.
Cons:
- Steep learning curve, particularly when integrating with Prometheus.
- Requires managing multiple tools for metrics collection and visualization.
4. New Relic
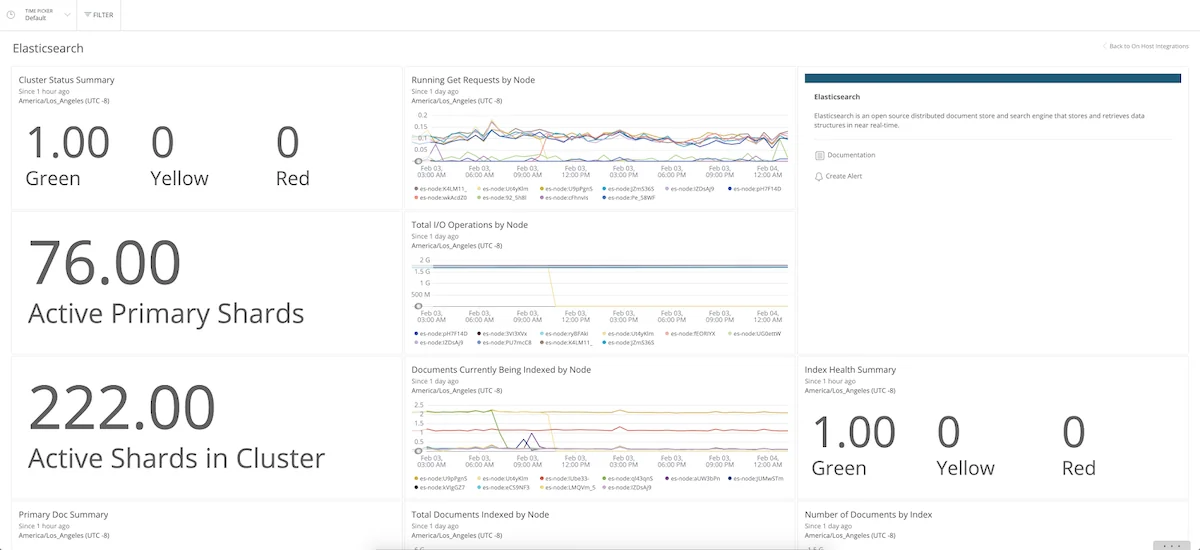
New Relic is a comprehensive Observability product offering full integration with Elasticsearch, making it simple to pull in various cluster, node, and index metrics. This tool enables monitoring of Elasticsearch clusters, as well as websites, mobile apps, systems, and applications.
For Elasticsearch monitoring, New Relic provides access to nearly all available cluster statistics, facilitating the creation of visualizations, dashboards, and alerts through various integrations.
However, due to its enterprise-grade nature, New Relic's learning curve may be steep, and its pricing can be costly for large teams with significant data needs. While a free tier is available for trial purposes, most production use cases require a paid subscription, with pricing based on user numbers and data processing volumes.
Pros:
- Fully featured observability platform
- Streamlined integration with Elasticsearch data
Cons:
- Potentially expensive
- Limited customization compared to other options
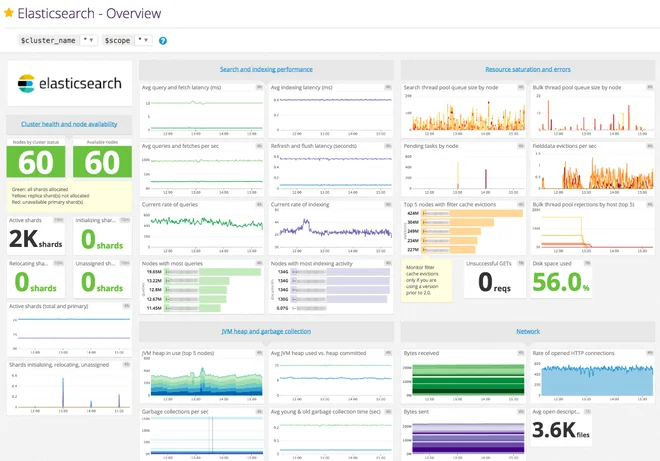
5. Datadog
Datadog, like New Relic, is a robust enterprise-grade observability tool offering comprehensive insights into Elasticsearch metrics and supporting various integrations for monitoring, visualization, dashboards, and alerts. A notable feature is its templating support, allowing quick access to pre-configured templates for dashboards and reports, simplifying setup and customization.
However, Datadog's main drawback is its high cost, making it one of the pricier monitoring solutions available. Despite this, it remains a strong choice for those needing comprehensive Elasticsearch monitoring alongside other infrastructure and application monitoring.
Pros:
- User-friendly interface
- Extensive out-of-the-box integrations
Cons:
- High cost
- Limited customization compared to some alternatives
6. Pulse
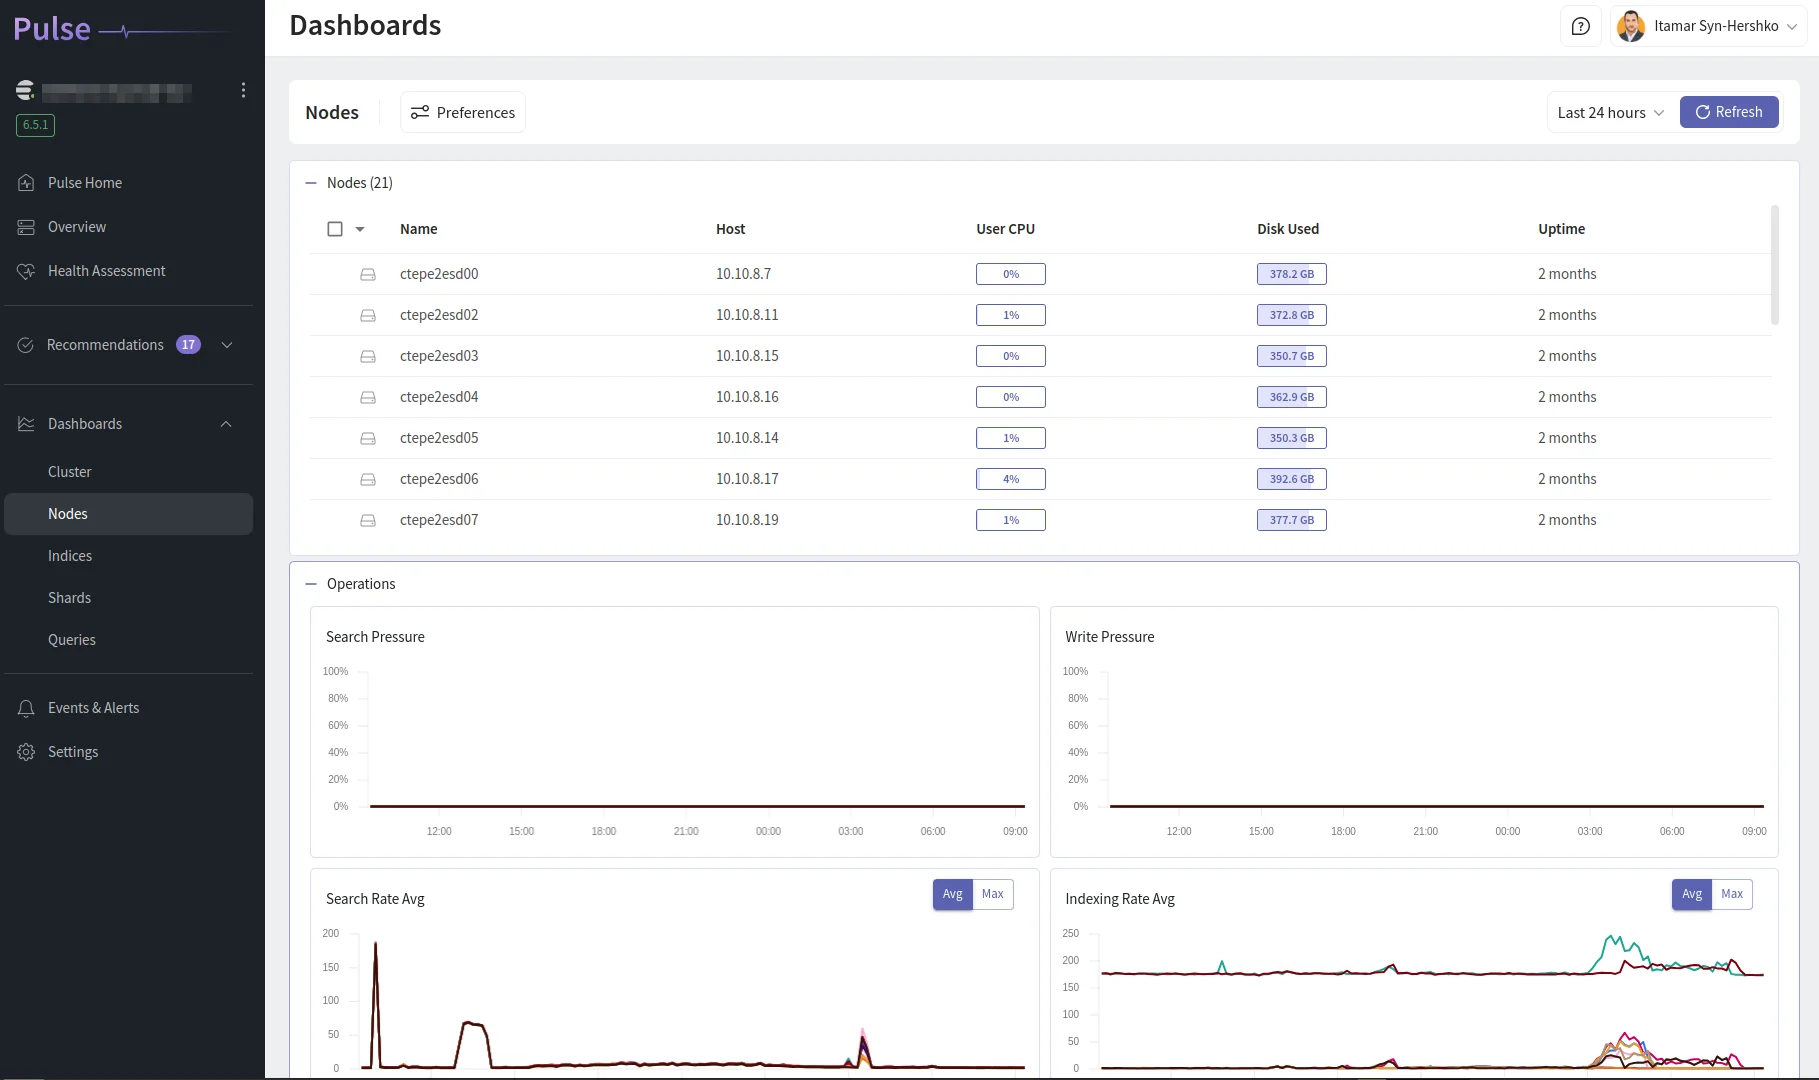
Pulse developed by the engineers at BigData Boutique, is an Elasticsearch monitoring solution designed to address critical issues efficiently. While many monitoring solutions offer alerts and graphs, they often require Elasticsearch expertise to respond effectively to problems, potentially resulting in prolonged downtime and revenue loss during software outages.
Pulse aims to mitigate these risks by providing tailored monitoring, visualizations, dashboards, and alerting. Unlike solutions with predefined alert thresholds, Pulse offers personalized monitoring suggestions based on your cluster's configuration, helping address current issues and prevent future catastrophes. It focuses on actionable insights to minimize alert fatigue.
Pulse's dashboards cover all aspects of Elasticsearch, including clusters, nodes, indices, and relevant operating system components, drawing on years of consulting experience to prioritize critical metrics
Additionally, Pulse features Query Analytics to analyze Elasticsearch query performance and supports OpenSearch. Furthermore, Pulse offers expert support from Elasticsearch engineers with industry-standard SLAs, ensuring fast issue resolution.
Pros:
- Powerful and flexible dashboarding
- Provides actionable insights to prevent future issues.
- Simple to set up and use.
- Expert support as part of the product offering.
Cons:
- No free or open-source option.
- Limited to Elasticsearch and relevant OS metrics
- Does not integrate with other monitoring tools
Our Recommendations
For Elasticsearch monitoring, excellent solutions are available, ranging from free options to commercial licenses. Choosing the right one depends on personal preference and specific requirements.
Due to our extensive experience with Elasticsearch and after using many different tools over the years, we developed and currently use Pulse ourselves for most use cases. We recommend Pulse for its comprehensive monitoring and alerting capabilities, providing actionable insights for cluster management.
Alternatively, Kibana, especially when used with hosted Elasticsearch solutions like Elastic Cloud, offers all necessary features out of the box.
Grafana is an excellent free and open-source monitoring solution for those prioritizing cost, However, if budget is not a concern and you seek a comprehensive observability platform covering Elasticsearch clusters, applications, logs, and metrics, consider New Relic or Datadog.
We hope this aids in making informed decisions regarding your Elasticsearch monitoring needs.


