Efrat Lehman Dahan
Elasticsearch Slow Logs can help identify issues and highlight slow queries. In this tip we show how to enable Elasticsearch slow logs, and how to access them on several platforms including OpenSearch.
Elasticsearch and Opensearch are highly scalable search and analytics engines, and as such they are often expected to respond to many concurrent requests, and still respond with a very low query latency.
Optimizing query performance in Elasticsearch and OpenSearch is a demanding task, but there absolutely are some clear guidelines one can follow, for example by avoiding expensive queries.
In order to identify and troubleshoot slow queries you can use the Search Slow Logs. When a search query takes longer than a specified threshold to execute, Elasticsearch will log information such as the query text, the time it took to execute, and the node that executed it.
Luckily, Elasticsearch supports logging slow operations, often called Slow Logs, for three key operations:
- Search Slow Log, for the query phase - logs shard-level slow queries with their full query source and additional information.
- Search Slow Log, for the fetch phase, where matching documents are retrieved.
- Indexing Slow Log - logs slow indexing operations.
To find and debug slow queries, we are interested in the Search Slow Logs, query phase.
Identifying Slow Queries in Elasticsearch & OpenSearch
Before anything else, it is important to highlight the fact slow logs on their own never reflect the full picture. It's not uncommon for clusters to experience temporary issues that cause normally fast queries to suddenly become slow; or have a larger issue (for example bad memory configurations) which will make certain queries or all of them to run slower.
Node types, concurrency, shard size and distribution, query structure and cache usage are some of the many different factors affecting query performance.
The key to understanding what's going on in your cluster is to thoroughly analyze all queries, not just the slow ones, in a way that facilitates deeper understanding of these underlying issues and paves the way for the ideal optimization processes. This, in conjunction with full cluster monitoring and observability is key to providing a thorough and holistic query optimization process. Read this article about Pulse’s Query Analytics feature, or contact us for more information.
Enabling Search Slow Logs
Whether you use OpenSearch or Elasticsearch, and wherever you have your cluster deployed, the process of enabling slow logs is generic for all installations.
Setting the latency thresholds that determine which operations will be logged, defining what the system tracks as “slow”, is done per index through its settings. You can of course set different thresholds for each of the slow log types (query, fetch and index).
By default, the thresholds are set to -1, which means they are never logged. If you want to log everything to enable proper analysis, you’ll define the threshold as 0, for example:
PUT my_index/_settings
  {
    "index.search.slowlog.threshold.query.info": "0s"
  }
You can also modify the thresholds for more than one index by using an index pattern, or just use the _all alias or * wildcard to modify the settings for all indexes (careful!).
Disabling Search Slow Logs
To disable slow logs, simply return all thresholds to -1 using the same command above.
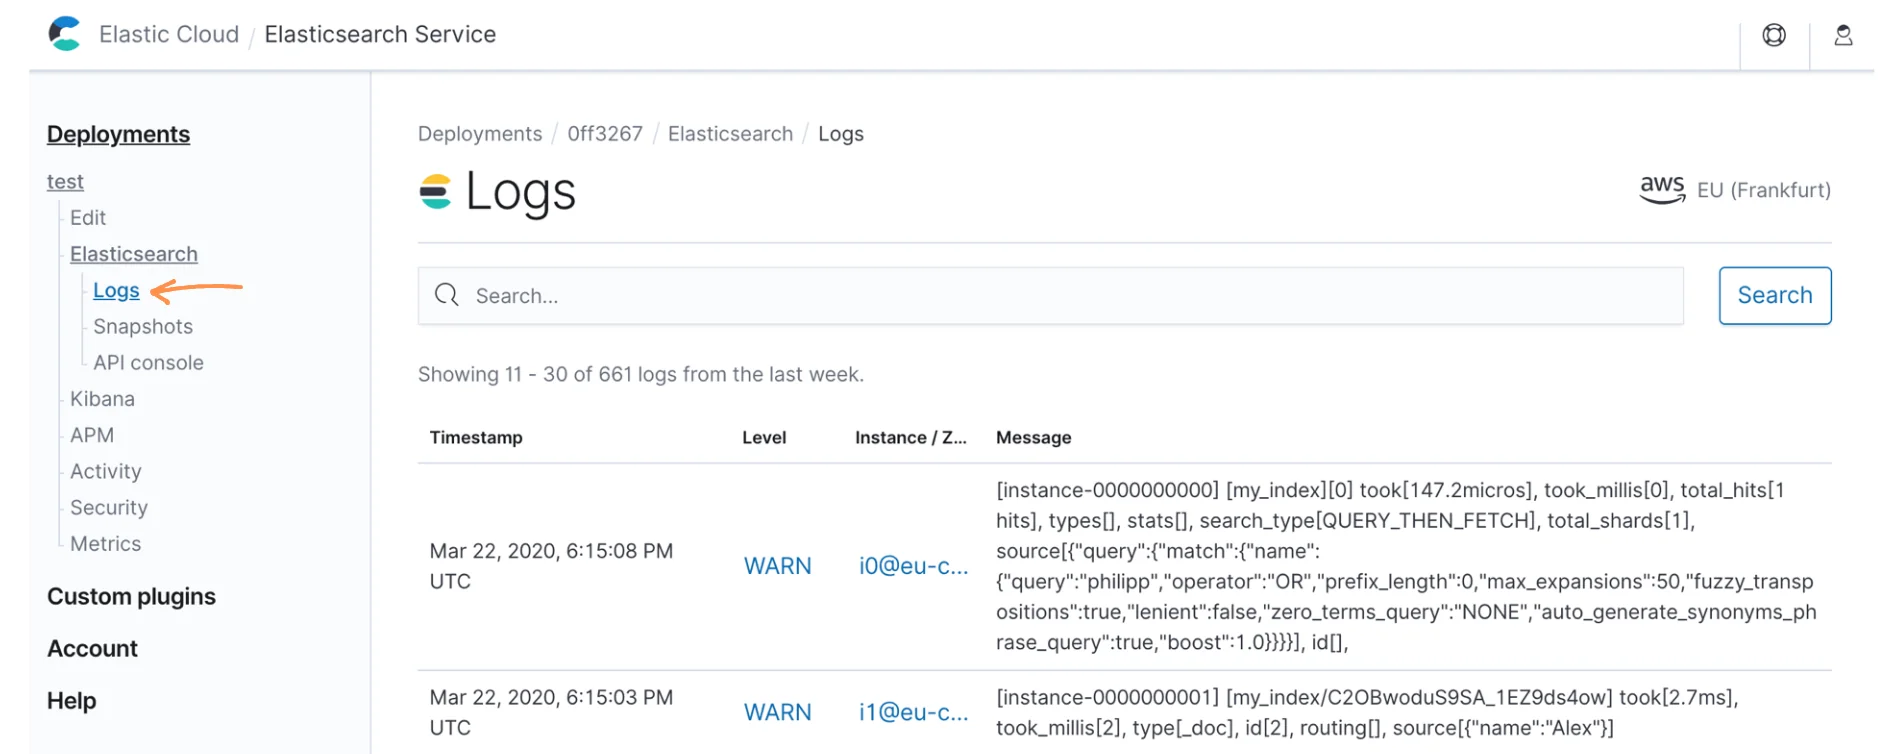
Accessing Elastic Cloud Slow Logs
Navigate to the “Overview” tab in the Elastic Cloud console, select “Logs” and search for logs with the tag index_search_slowlog:
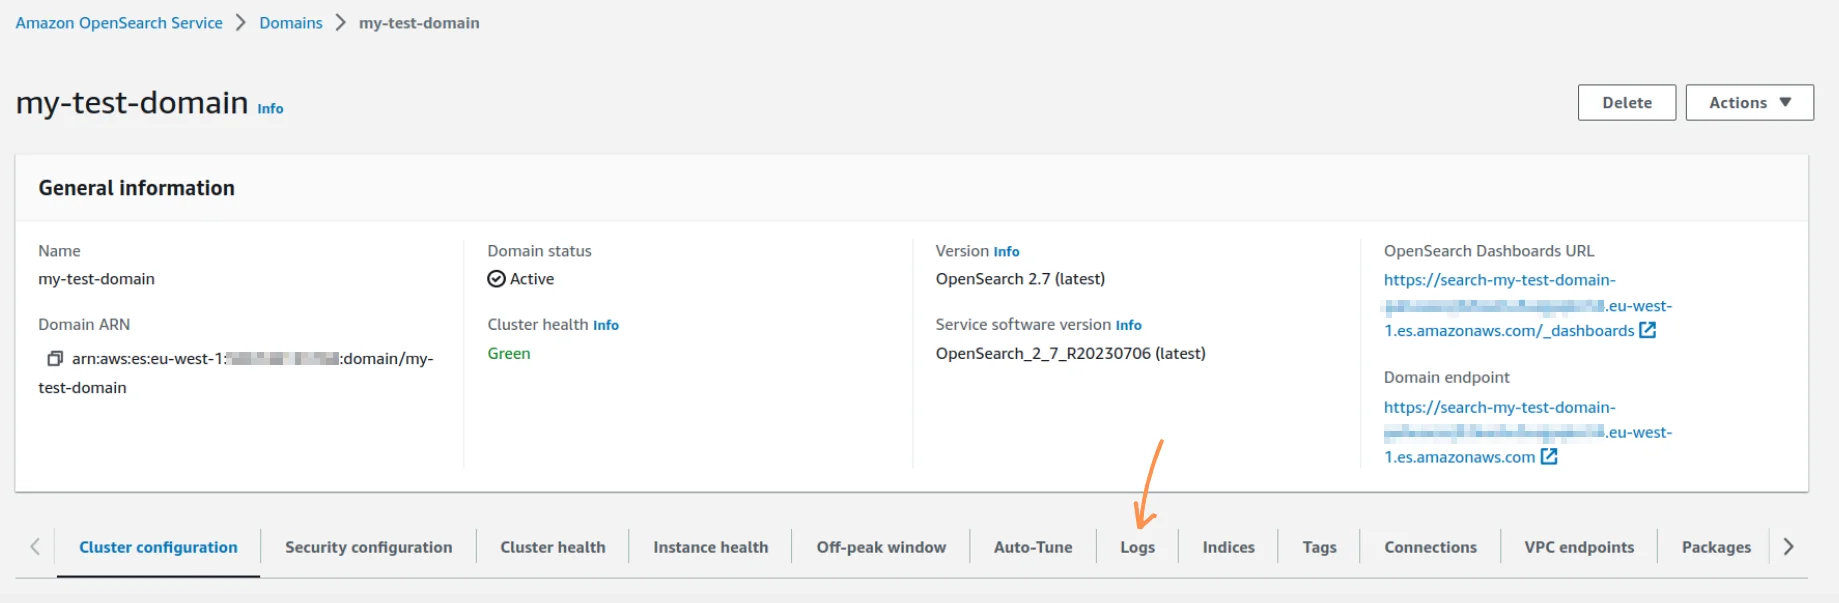
Accessing Amazon OpenSearch Service Slow Logs
If you’re running on the AWS managed OpenSearch service, you’ll need to first direct the collection of slow logs to CloudWatch, the AWS logging service.
To do this. sign in to the AWS management console and go to OpenSearch service.
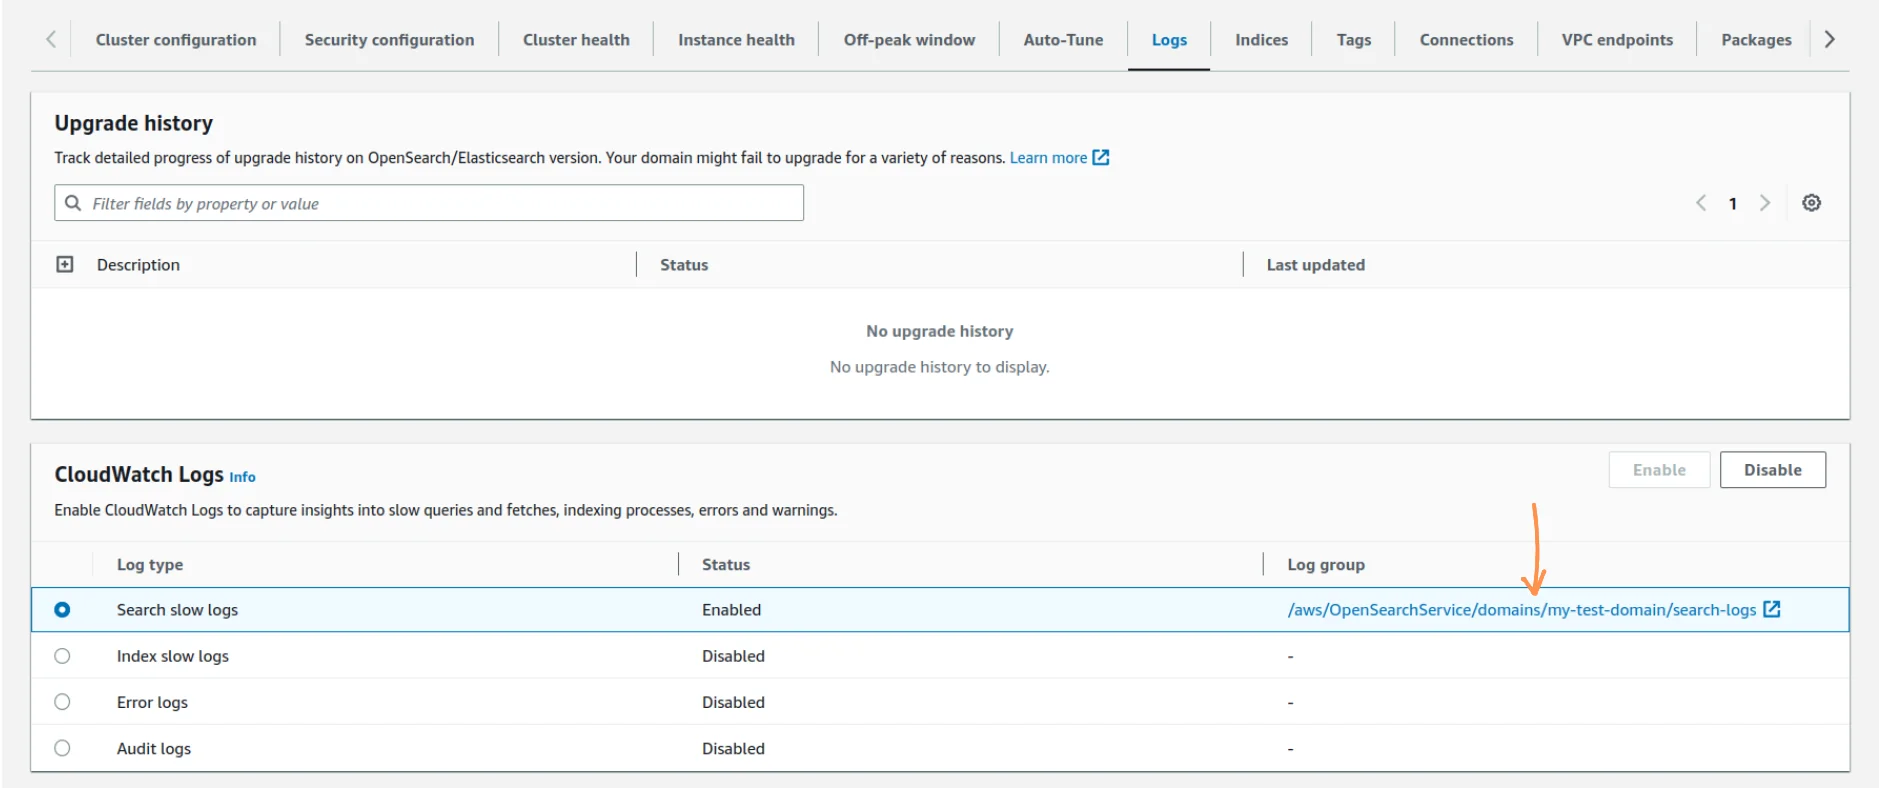
Select your domain name from the list to open the dashboard, and then choose the “Logs” tab:
Search and index slow logs can be enabled or disabled independently. Choose a log type and click on “Enable”:
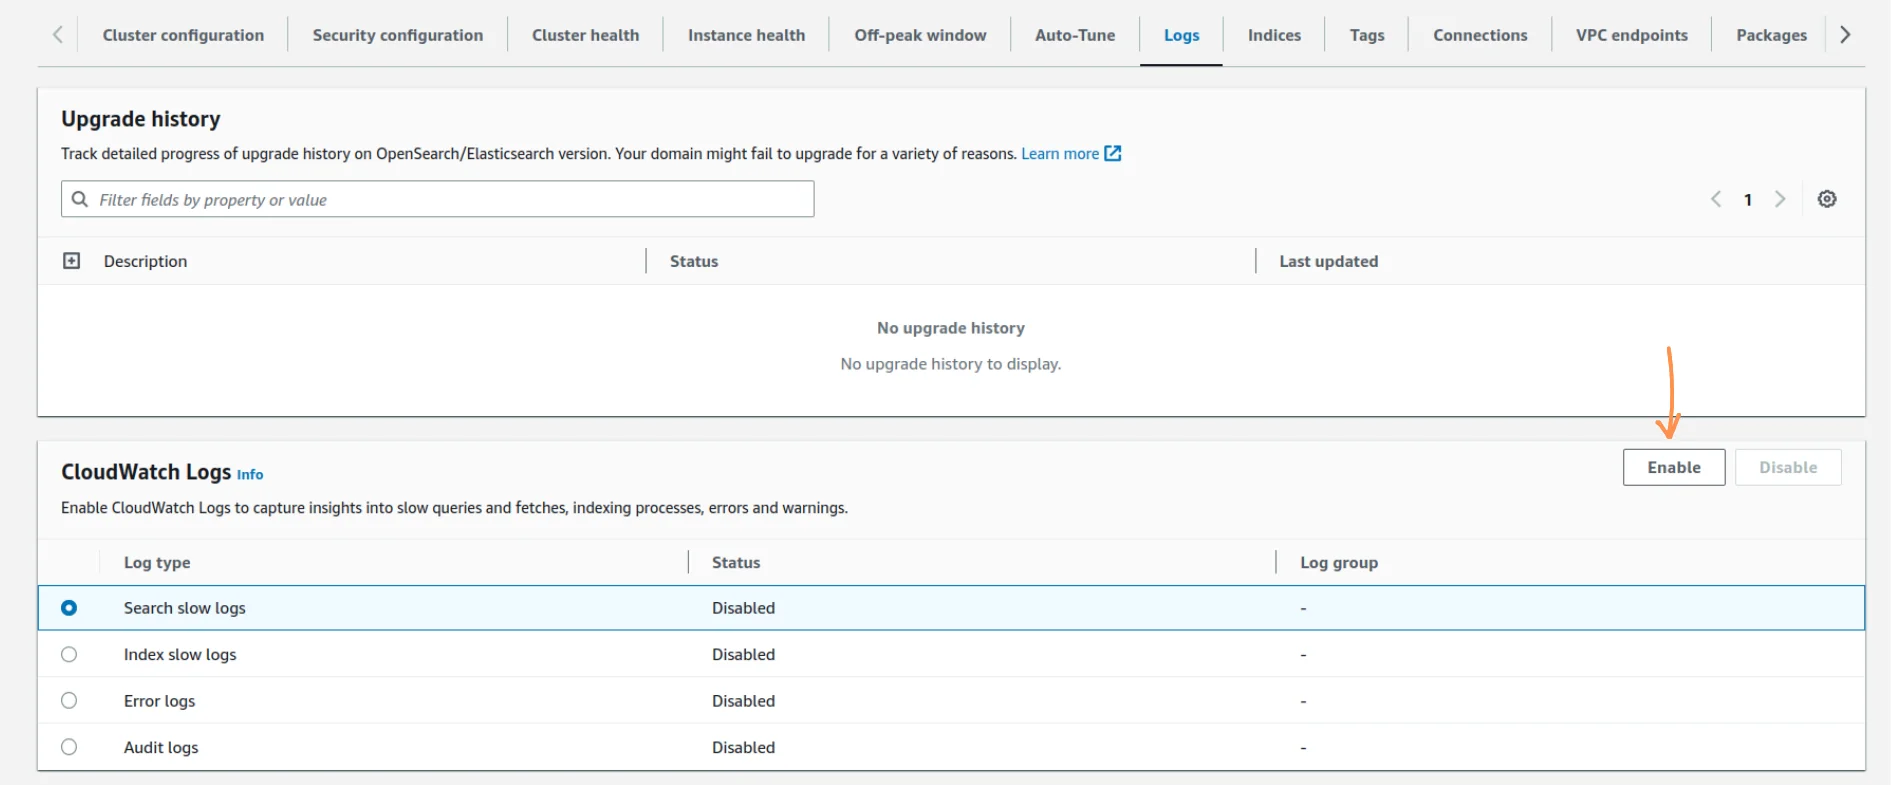
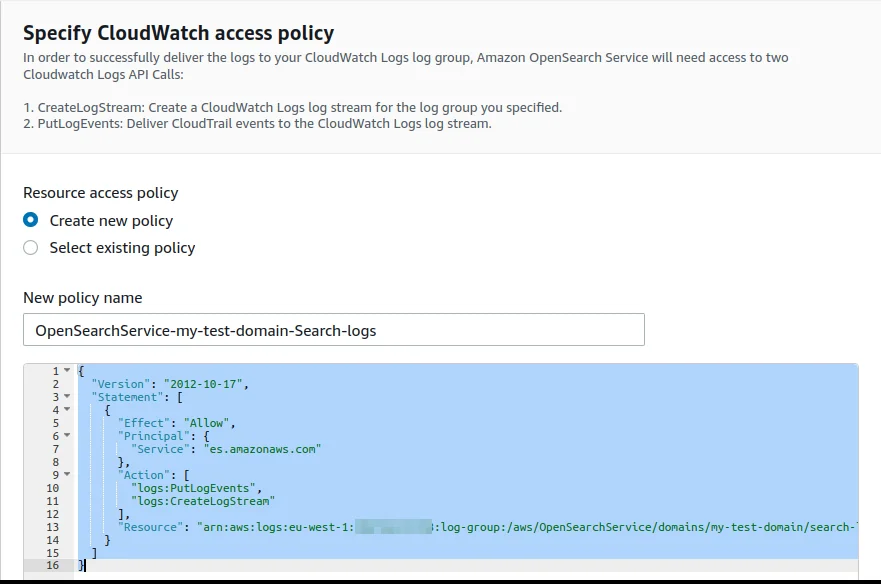
Create a new CloudWatch log group as a path, for example: /aws/OpenSearchService/domains/my-test-domain/search-logs. Make sure you either use an existing permission policy that allows the OpenSearch domain to push logs into the specified log group or create a new one. For example:
To view the logs, select the log group name under “CloudWatch Logs”:
Accessing OpenSearch Slow Logs (self-managed)
On Docker, most logs will be directed to the console. You will be able to find the rest in opensearch/logs/.
On Linux, you will find them in /var/log/opensearch/.
Accessing Elasticsearch Slow Logs (self-managed)
As with OpenSearch, most logs on Docker will be directed to the console. You can find the rest in elasticsearch/logs/.
On Linux, you will find them in /var/log/elasticsearch/.
Slow-log analysis is only the start. For end-to-end query diagnosis, mapping audits, and cluster tuning, see our OpenSearch consulting services.