

 Lior Friedler
A production deep-dive into the PostgreSQL to Kafka to Iceberg CDC path with Debezium: pgoutput logical decoding, replication slots, snapshot strategies, throughput tuning, delivery guarantees, and Iceberg sink options.
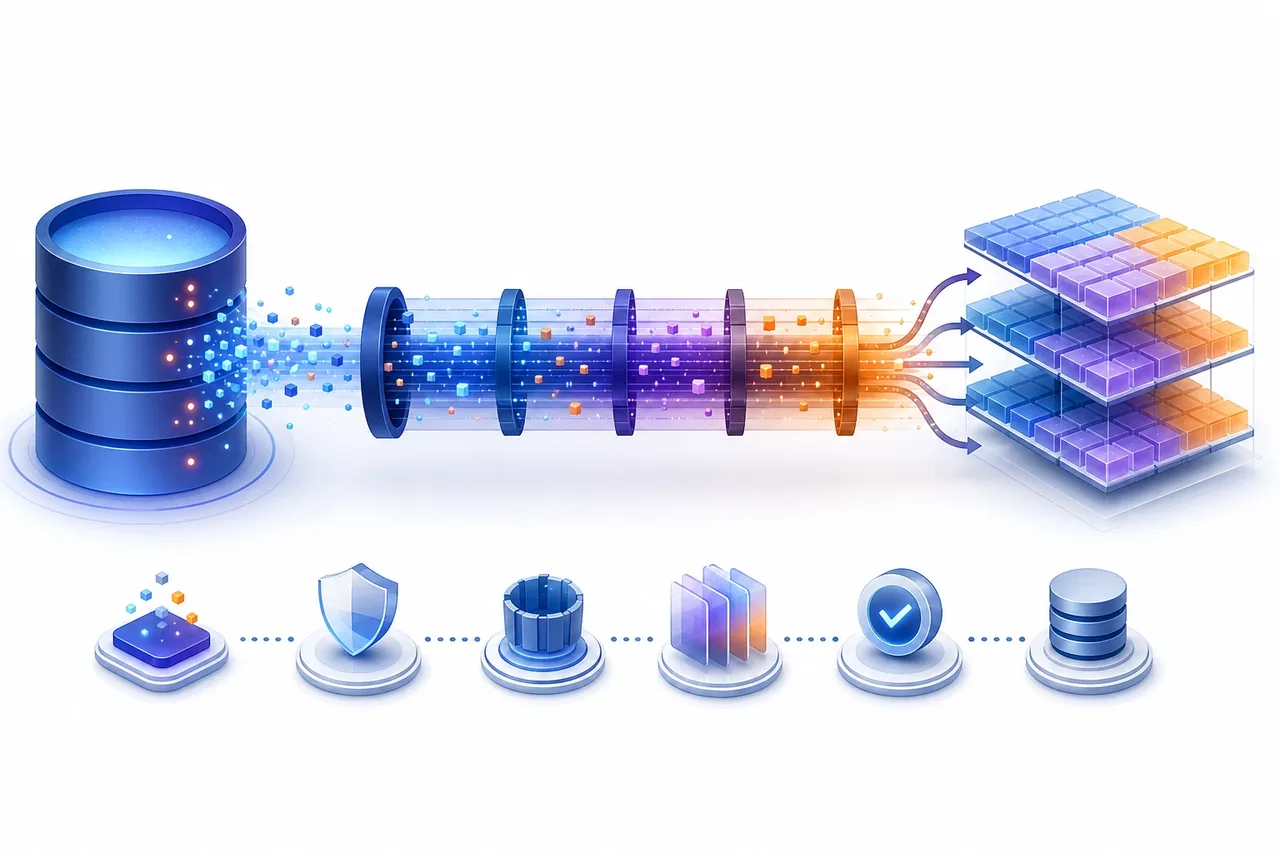
Change Data Capture sounds simple until you run it. You point Debezium at a PostgreSQL primary, events land in Kafka, a sink writes them to Apache Iceberg, and you have a lakehouse mirror of your operational database. The demo works in an afternoon. Then a connector restarts during a long snapshot, a replication slot quietly eats 400 GB of disk over a weekend, and an ALTER TABLE breaks the sink because nobody planned for schema evolution.
This guide is about the parts that the quickstart tutorials skip. It covers the PostgreSQL to Debezium to Kafka to Iceberg path specifically, focused on what survives contact with production: how logical decoding actually feeds Debezium, which snapshot mode to pick, why replication slots are the most dangerous component in the whole pipeline, and what your options are for landing CDC events in Iceberg tables with correct deletes. For where log-based CDC fits among the other pipeline shapes, see our overview of ETL pipeline patterns in 2026.
How Debezium reads PostgreSQL: logical decoding and replication slots
Debezium is a log-based CDC platform, and one of several options we weigh against managed services in our data migration tools comparison. Instead of polling tables or comparing timestamps, it reads the database's transaction log and emits a change event for every row-level insert, update, and delete. On PostgreSQL that transaction log is the Write-Ahead Log (WAL), and the mechanism that turns raw WAL into a consumable stream is logical decoding.
Logical decoding is the PostgreSQL feature that extracts row-level change events from the WAL and streams them to an external consumer through a replication slot. It requires
wal_level = logicaland turns physical log records into a logical representation of inserts, updates, and deletes.
Three pieces have to line up before Debezium can stream a single event:
wal_level = logicalinpostgresql.conf. The default isreplica, which carries enough information for physical standbys but not for logical decoding. Changing this requires a restart, so plan it into a maintenance window.- A logical decoding output plugin. This is the code that formats decoded WAL into a wire format. Debezium's PostgreSQL connector supports two:
pgoutputanddecoderbufs(wal2jsonsupport was removed back in Debezium 2.0). Usepgoutput, and note that you have to ask for it: theplugin.nameproperty still defaults todecoderbufs, a Debezium-maintained Protobuf plugin that needs a native extension compiled onto the server.pgoutputships inside PostgreSQL 10+ and is maintained by the Postgres community itself, so there is nothing to install, and managed services like RDS and Cloud SQL only supportpgoutputanyway. Set it explicitly in every connector config. - A replication slot. The slot is a named, server-side cursor that tracks how far a consumer has read into the WAL. Debezium creates one (default name
debezium) and uses it to resume from the exact LSN it last confirmed.
With pgoutput you also get a publication, the Postgres object that defines which tables are part of the logical replication stream. Debezium will create one named dbz_publication for all tables by default. On a busy primary you usually do not want that. Set publication.autocreate.mode to filtered so the publication only contains the tables the connector actually captures, which also keeps WAL volume down.
A minimal, production-shaped connector config looks like this:
{
    "name": "pg-orders-connector",
    "config": {
      "connector.class": "io.debezium.connector.postgresql.PostgresConnector",
      "database.hostname": "pg-primary.internal",
      "database.port": "5432",
      "database.user": "debezium",
      "database.dbname": "appdb",
      "topic.prefix": "appdb",
      "plugin.name": "pgoutput",
      "slot.name": "debezium_orders",
      "publication.name": "dbz_orders",
      "publication.autocreate.mode": "filtered",
      "table.include.list": "public.orders,public.order_items",
      "snapshot.mode": "initial",
      "heartbeat.interval.ms": "10000",
      "signal.data.collection": "public.debezium_signal"
    }
  }
One non-obvious operational fact: a logical replication slot is bound to a single database and lives only on the primary. It is not replicated to physical standbys. If you fail over to a standby, the slot is gone, and Debezium cannot resume from where it left off. Plan failover explicitly: on PostgreSQL 17 and later you can synchronize logical slots to standbys with the failover slot property and sync_replication_slots = on on the standby; on anything older, the plan is recreating the slot on the new primary and re-snapshotting. We cover the broader high-availability picture in our guide to PostgreSQL multi-node high availability.
The replication slot disk-growth failure mode
If you remember one thing from this article, make it this. The single most common way a Debezium PostgreSQL pipeline takes down the source database is WAL accumulation behind a stalled replication slot.
A PostgreSQL replication slot prevents the server from recycling any WAL segment that the slot's consumer has not yet confirmed. If Debezium stops consuming, the WAL is retained on the primary's disk and grows without bound until the connector resumes or the disk fills.
The mechanism is simple and unforgiving. Postgres advances a slot's position only when its consumer acknowledges progress, and WAL segments older than the slowest slot's restart_lsn cannot be removed. So any time Debezium stops acknowledging, for example a crashed connector, a long network partition, a paused task, or a Kafka outage that blocks the producer, the primary keeps every WAL segment generated since. On a high-write database that can be tens of gigabytes per hour. When the data partition fills, PostgreSQL stops accepting writes, and now your CDC tool has caused a production outage.
There is a second, quieter version of this problem. Even a healthy connector can fall behind if it is watching a low-traffic set of tables on a high-traffic database. Logical decoding has to read through all WAL, including changes to tables you do not capture, but the slot's confirmed position only advances when Debezium sends a flush. If nothing it cares about changes for a while, the slot stays pinned at an old LSN even though the database is busy.
The fix is heartbeats. Set heartbeat.interval.ms so Debezium periodically emits a heartbeat event, which forces a flush and advances the slot. Pair it with heartbeat.action.query, a statement Debezium runs against the source on each heartbeat so there is always a fresh change to decode and confirm:
{
    "heartbeat.interval.ms": "10000",
    "heartbeat.action.query": "INSERT INTO public.debezium_heartbeat (id, ts) VALUES (1, now()) ON CONFLICT (id) DO UPDATE SET ts = now()"
  }
Gunnar Morling's deep dive on mastering Postgres replication slots is the canonical reference here and worth reading in full. Operationally, you need three guardrails regardless of heartbeats:
- Alert on
pg_replication_slots. Monitorpg_wal_lsn_diff(pg_current_wal_lsn(), restart_lsn)per slot —restart_lsnis the position WAL retention is actually keyed to — and page someone before retained WAL approaches your free disk. On PostgreSQL 13+ also watch thewal_statuscolumn;lostmeans the slot is already dead. - Set
max_slot_wal_keep_size(PostgreSQL 13+). This caps how much WAL a slot may retain. The slot is invalidated past the cap, which loses CDC continuity but saves the database. That is the right trade when the alternative is a downed primary. - Drop orphaned slots. If you delete a connector, drop its slot. An abandoned slot retains WAL forever.
Snapshots: getting existing data without freezing the database
A fresh connector has to capture rows that existed before CDC started. That is the snapshot. Debezium reads the current table contents and emits them as read events (op: "r"), then switches to streaming WAL changes. How it does that is controlled by snapshot.mode, and the choice matters a lot on large tables.
| Snapshot mode | What it does | When to use it |
|---|---|---|
initial (default) |
Snapshot all captured tables once, then stream | Most new pipelines; default and safest starting point |
initial_only |
Snapshot, then stop without streaming | One-time bulk load into Iceberg, no ongoing CDC |
no_data |
Skip snapshot, stream from current WAL position | Tables already loaded by another process; you only want new changes (replaces the deprecated never) |
when_needed |
Snapshot only if offsets are missing or the WAL position is gone | Self-healing restarts, at the cost of surprise snapshots |
always |
Snapshot on every connector start | Rare; testing or environments where prior state cannot be trusted |
custom |
Plug in your own snapshotter implementation | Specialized loading logic |
The standard initial snapshot is consistent but blunt. Locking is not the concern it once was: older connector versions took an ACCESS SHARE lock during the initial phase, which never blocked writes, only schema changes, and current versions default to snapshot.locking.mode = none. The real cost is that a snapshot of a multi-terabyte table is a long, single-threaded read that holds the export transaction open and delays the start of streaming. If the connector dies at 80% through that snapshot, it starts over from zero.
Incremental snapshots solve this. Introduced in the DDD-3 design document and described in Debezium's incremental snapshots blog post, an incremental snapshot reads a table in chunks while the connector keeps streaming live WAL changes at the same time. Chunks are watermarked so that a streamed change to a row already captured wins over the snapshot read, which keeps the result consistent without a long-held lock. Crucially, incremental snapshots are resumable: a restart picks up at the last completed chunk instead of restarting the whole table.
You trigger one with an ad-hoc signal. Debezium watches a signaling table named in signal.data.collection, and you start a snapshot by inserting an execute-snapshot row:
INSERT INTO public.debezium_signal (id, type, data)
  VALUES (
    'snap-orders-2026-07',
    'execute-snapshot',
    '{"data-collections": ["public.orders"], "type": "incremental"}'
  );
This is how you add a new table to an existing pipeline without restarting the connector or re-snapshotting everything. If your Debezium user has read-only database permissions and cannot write to a signaling table, Debezium also supports sending signals through a Kafka signaling topic instead.
The change event, schema changes, and delivery guarantees
Every Debezium message is a structured envelope, not a raw row. The shape is consistent across databases: a before image, an after image, an op code, a source block with metadata like LSN and transaction ID, and a ts_ms timestamp.
Debezium's change event envelope carries
opcodes ofc(create/insert),u(update),d(delete),r(read, emitted during snapshots), andt(truncate). An insert has a nullbeforeand a populatedafter; a delete has a populatedbeforeand a nullafter; an update has both.
That before/after/op structure is exactly what a downstream Iceberg sink needs to reconstruct the table state, so do not flatten it away unless you know your sink expects flat rows.
One thing you do not have to manage here, despite what a lot of Debezium material implies: a schema history topic. That requirement belongs to the MySQL, Oracle, and SQL Server connectors. The PostgreSQL connector has no schema.history.internal.* properties at all, because pgoutput carries relation metadata in the replication stream and the connector reads table schemas from the database itself. If you copied schema.history.internal.kafka.topic into a Postgres connector config from a MySQL example, it is dead weight.
Schema changes still need a plan, though. An additive change such as a new nullable column flows through cleanly when consumers and the sink honor schema evolution. Pair Debezium with a schema registry and Avro so that schema versions are tracked and compatibility is enforced. Breaking changes (dropping a column, narrowing a type) need coordination with downstream consumers regardless of tooling, the same discipline that any schema migration on a live system demands.
For delivery guarantees, the honest default is at-least-once. Debezium tracks offsets in Kafka Connect; on restart it can replay events it had read but not yet committed an offset for, so duplicates are possible. Since Kafka 3.3 there is a real fix: Kafka Connect supports exactly-once for source connectors (KIP-618), Debezium supports it for PostgreSQL, and enabling it means setting exactly.once.source.support = enabled on every distributed worker plus exactly.once.support = required in the connector config. Short of that, every event carries its source LSN, so a downstream consumer can deduplicate on (source.lsn, op). End-to-end correctness in Iceberg is a property of the sink either way, which brings us to the last and trickiest part.
| Guarantee | Where it comes from | Practical implication |
|---|---|---|
| At-least-once | Debezium default behavior | Duplicates possible on restart; dedupe downstream on LSN |
| Exactly-once source | Kafka Connect 3.3+ (KIP-618), worker + connector config | Removes restart duplicates from Debezium into Kafka |
| Exactly-once sink | Iceberg sink commit coordination (control topic) | Needed so replays do not double-write table commits |
Tuning throughput, and the metrics that tell you when to
The connector's defaults are sized for moderate traffic. When a pipeline needs to keep up with a heavy write load, or catch up after an outage, there are three places to work on, and none of them are the WAL side.
The internal queue. Debezium decouples reading the replication stream from Kafka Connect: the streaming thread pushes decoded events into an in-memory queue, and the Connect task thread polls batches out of it. Four properties control this, with defaults straight from the connector docs: max.queue.size (8192 events), max.batch.size (2048 events per poll), max.queue.size.in.bytes (0, meaning disabled), and poll.interval.ms (500). Two things matter in practice. First, keep max.queue.size at roughly four times max.batch.size when you raise either; a big queue feeding tiny batches just moves the bottleneck. Second, set max.queue.size.in.bytes to something explicit. The queue limit is counted in events, and an event with wide before and after images can run to hundreds of kilobytes, so 8192 of them can be gigabytes of heap. A byte cap turns a potential OOM into ordinary backpressure. And know what backpressure looks like here: when the queue fills, the connector simply stops reading WAL, so a slow sink shows up as replication slot lag on the database, not as an error in Connect.
The producer. Events leave through a standard Kafka producer owned by the Connect worker, and since Kafka 2.3 you can tune it per connector with the producer.override. prefix (the worker's connector.client.config.override.policy allows this by default since Kafka 3.0):
{
    "producer.override.compression.type": "lz4",
    "producer.override.batch.size": "262144",
    "producer.override.linger.ms": "50",
    "producer.override.max.request.size": "2097152"
  }
Compression is the highest-value line. Debezium envelopes are large and repetitive, especially as schemaless JSON where every event repeats its schema, and lz4 or zstd routinely cuts the produced bytes by several times, which you feel in network, broker disk, and consumer throughput all at once. A bigger batch.size with a modest linger.ms trades a few dozen milliseconds of latency for much better batching during snapshots and catch-up. Raise max.request.size if you capture tables with large text or TOASTed columns, and remember the topic's max.message.bytes has to grow with it.
The metrics. Debezium exposes JMX metrics per connector under debezium.postgres:type=connector-metrics,context=streaming,server=<topic.prefix> (and a matching context=snapshot MBean). Four are worth wiring into dashboards on day one:
MilliSecondsBehindSourceis your headline lag number, the delay between the change being written to WAL and Debezium processing it. Alert on it the same way you alert on consumer lag.QueueRemainingCapacityagainstQueueTotalCapacitytells you which side is slow. Remaining capacity pinned near zero means the queue is full, so the bottleneck is the Connect task or the producer, and the tuning above applies. Queue mostly empty while lag grows means decoding itself is behind, and the fix lives on the Postgres side.TotalNumberOfEventsSeenas a rate gives you baseline throughput, andMilliSecondsSinceLastEventcatches a silently stalled stream.- On the snapshot MBean,
SnapshotRunning,SnapshotCompleted, andRowsScannedper table let you answer "how far along is it" without guessing, and incremental snapshots additionally report their current chunk.
Pair these with the pg_replication_slots query from earlier, and one blunt check: a Connect task in FAILED state stops reporting metrics entirely, so scrape task status from the Connect REST API too. Silence is not health.
Sinking CDC into Iceberg: deletes are the hard part
Appending inserts to Iceberg is easy. The challenge is representing updates and deletes, because a CDC stream of u and d events has to translate into row-level mutations on the table. Iceberg handles this with V2 format and equality deletes, delete files that mark rows matching a set of identifier-column values as removed. Your sink has to emit those correctly, and not every sink does.
There are two mainstream paths from Kafka to Iceberg, plus a Kafka-free option.
Apache Iceberg Kafka Connect sink. This is the connector that was donated to the Apache Iceberg project (formerly the Tabular sink) and is now maintained in the Iceberg repo. It gives you exactly-once delivery through a control topic and commit coordinator, multi-table fan-out, automatic table creation, and schema evolution. What it does not give you, and this catches a lot of teams, is upsert or delete handling. The CDC and upsert modes of the original Tabular connector (iceberg.tables.cdc-field, iceberg.tables.upsert-mode-enabled) were never part of the Apache release, and the request to add them was closed as not planned. The Apache connector appends every record, so a Debezium update or delete event lands as a new row, duplicates and all. It does ship a DebeziumTransform SMT that flattens the envelope and adds _cdc metadata such as _cdc.op, which makes it an excellent writer for the append-only bronze layer described below — just do not point it at a table you expect to reflect current state.
Debezium to Kafka to Flink to Iceberg. When the target table has to reflect current state, route the stream through Apache Flink. Flink's debezium-json format turns the envelope into +I/-U/+U/-D changelog rows natively, and the Flink Iceberg connector writes upserts as equality deletes when the table is format V2 with identifier fields defined and write.upsert.enabled is set — that identifier-field requirement is what equality deletes key on, so it is not optional. This is the most flexible path and the one we reach for on demanding pipelines; the trade-off is operating a Flink cluster. We go deep on this combination in Flink and Iceberg: a powerful duo, and on the broader streaming stack in the Kafka, Flink, and ClickHouse architecture blueprint.
Debezium Server (no Kafka). Debezium Server Iceberg runs Debezium as a standalone process that writes straight to Iceberg, skipping Kafka and Kafka Connect entirely, and unlike the Apache Kafka Connect sink it does support an upsert mode with real delete handling. It is a clean fit when the lakehouse is the only consumer and you do not need Kafka as a shared event backbone. You lose Kafka's buffering, replay, and fan-out, so weigh it against a Kafka-centered design rather than treating it as a strict upgrade.
A pattern that works well regardless of sink, and the only correct one if you use the Apache Kafka Connect sink: land raw Debezium events in an append-only bronze Iceberg table first, then build a merged silver table from it with a periodic MERGE in Spark or Trino, or a Flink job. Bronze gives you a replayable, immutable audit log of every change; silver gives you the current-state table your analysts query. Whatever your sink choice, keep up with Iceberg table maintenance, because equality deletes and frequent small commits produce many delete files and small data files that degrade read performance until they are compacted.
Key takeaways
- Use
pgoutput, and set it explicitly. The connector still defaults todecoderbufs;pgoutputships with PostgreSQL 10+, needs no server-side install, and is the only option on most managed Postgres services. Setwal_level = logicaland scope your publication withpublication.autocreate.mode = filtered. - Replication slot disk growth is the top production risk. A stalled or pinned slot retains WAL until the primary's disk fills. Enable heartbeats, alert on
restart_lsnlag inpg_replication_slots, setmax_slot_wal_keep_size, and drop orphaned slots. - Prefer incremental snapshots for large tables. They stream concurrently, resume after a crash, and let you add tables via an
execute-snapshotsignal without restarting the connector. - Tune the queue and the producer before blaming Postgres. Size
max.queue.size/max.batch.sizetogether, cap the queue in bytes, and setproducer.override.compression.type. WatchMilliSecondsBehindSourceandQueueRemainingCapacityto see which side of the connector is actually behind. - Deletes drive your sink choice. Updates and deletes need Iceberg V2 equality deletes keyed on identifier fields. The Apache Iceberg Kafka Connect sink is append-only, so use it for bronze; Flink or Debezium Server Iceberg are the paths that maintain a current-state table.
- Adopt bronze/silver. Append raw events to immutable bronze, merge into queryable silver, and run regular compaction to keep delete files and small files under control.
Getting a Postgres to Iceberg CDC pipeline running is a weekend project. Getting one that survives failovers, schema changes, and a Kafka outage at 3 a.m. is a different exercise. If you are designing or stabilizing a CDC and lakehouse pipeline, our data engineering consulting team does this work for streaming and data platforms in production.